

Instantly Discover Bullish & Bearish Signals in Any Stock
Technical analysis is powerful, but identifying candlestick patterns manually across hundreds of stocks can be time-consuming and error-prone.
xCalData is excited to introduce our new Candlestick Pattern Intelligence feature, designed to help investors and traders quickly identify the bullish and bearish candlestick formations that a stock has generated over time.
What Does It Do?
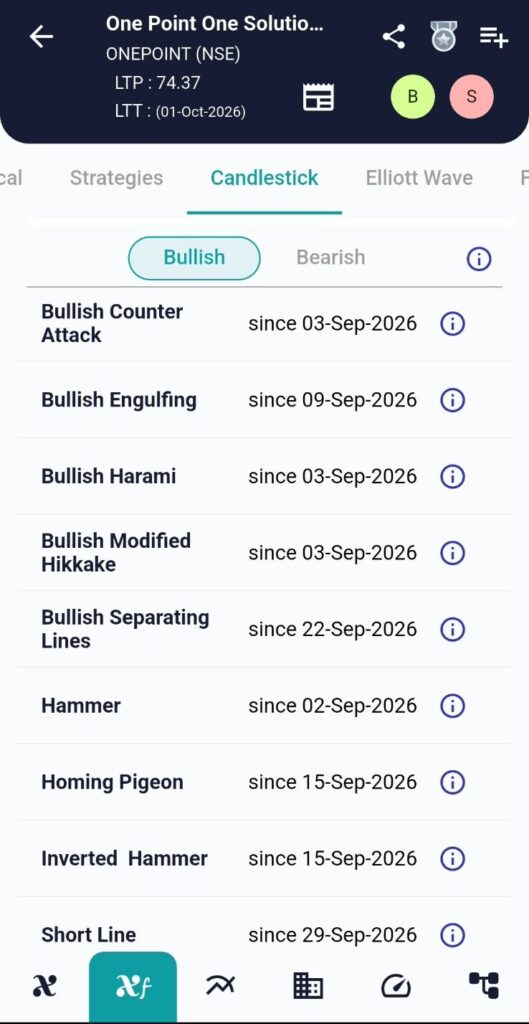
The new Candlestick tab automatically scans price action and identifies recognised candlestick patterns, categorising them into:
✅ Bullish Patterns
✅ Bearish Patterns
For every detected pattern, the system displays:
- Pattern Name
- Date of occurrence
- Pattern category (Bullish/Bearish)
- Detailed explanation of the pattern
- Historical reference for validation
Why It Matters
Candlestick patterns often provide valuable insights into market sentiment and possible future price movements.
Instead of manually analysing charts, traders can now instantly see patterns such as:
- Bullish Engulfing
- Bullish Harami
- Hammer
- Inverted Hammer
- Homing Pigeon
- Bullish Counter Attack
- Bullish Separating Lines
- Modified Hikkake
- Shooting Star
- Bearish Engulfing
- Dark Cloud Cover
- Evening Star
- And many more
This allows investors to quickly understand whether recent price action is signalling potential strength or weakness.
Key Benefits
Faster Analysis
Eliminate the need to manually inspect every candlestick on the chart.
Pattern History
Know exactly when a specific pattern was last formed.
Better Decision Making
Use historical pattern occurrences as an additional layer of confirmation before entering or exiting trades.
Educational Insights
Every pattern comes with its explanation, helping investors learn technical analysis while investing.
Built for Smarter Investing
A single candlestick pattern should never be treated as a buy or sell recommendation. However, when combined with trend analysis, support and resistance levels, volume, Elliott Waves, and other technical indicators, pattern recognition can become a valuable decision-support tool.
Our objective is simple:
Transform complex chart reading into actionable market intelligence that helps investors and traders analyse stocks faster, smarter, and with greater confidence.
Explore the new Candlestick Pattern Intelligence feature today and uncover the hidden stories your charts are telling.
