Technical Indicator
Posted On: February 5, 2024
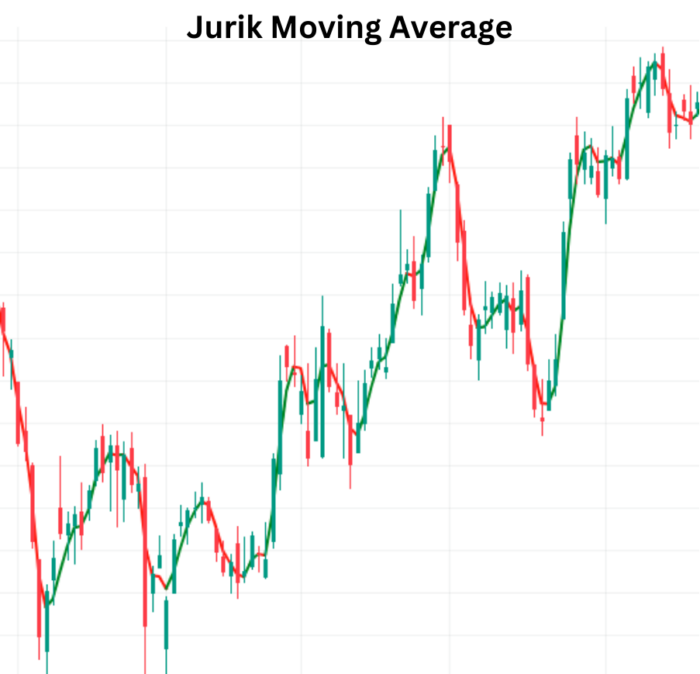
Jurik Moving Average (JMA): A Profit Trading Insight
The Jurik Moving Average (JMA) is a powerful technical indicator designed to guide traders in making informed decisions by assigning greater weight to recent data. Let’s delve into the intricacies of JMA calculation and explore how to interpret its values for effective trading strategies.
Understanding JMA Calculation:
1) JMA Phase Ratio:
- Calculation:
- If
jma phaseis less than -100,jma_phase_ratiois set to 0.5. - If
jma phaseis greater than 100,jma_phase_ratiois set to 2.5. - Otherwise,
jma_phase_ratiois calculated as(jma phase / 100) + 1.5.
- If
2) JMA Beta and Alpha:
- Initialization:
jma = 0.0, e0, e1, e2 = 0.0, 0.0, 0.0 - Variables to store intermediate values during the JMA calculation.
3) JMA Calculation Loop:
- The JMA calculation is performed in three loops, updating intermediate variables (
e0,e1,e2) based on the price data.
Interpreting Jurik Moving Average for Trading:
Buy and Sell Signals:
- If the price crosses the JMA line from above, it could signify the beginning of a downtrend, suggesting a selling opportunity.
- If the price crosses the JMA from below, it might indicate the start of an uptrend, presenting a buying opportunity.
Algorithm Implementation:
- Based on
'Jurik Moving Average Value'and'Close Price', the following interpretations can be derived:- If yesterday’s
JMA_Valueis above yesterday’sClose Price, and the currentJMA_Valueis equal to or lesser than the currentClose Price, the code assigns “Buy.” - If yesterday’s
JMA_Valueis above yesterday’sClose Price, and the currentJMA_Valueis equal to or less than the currentClose Price, the code assigns “Sell.” - If none of the above conditions are met, the corresponding value will be assigned as ‘Hold.’
- If yesterday’s
Conclusion:
The JMA stands as a sophisticated tool in the trader’s arsenal, offering insights into trend dynamics. By grasping the nuances of JMA calculation and leveraging its signals judiciously, traders can enhance their decision-making processes and navigate the markets with confidence. May your trading journey be enriched with the strategic deployment of the Jurik Moving Average!
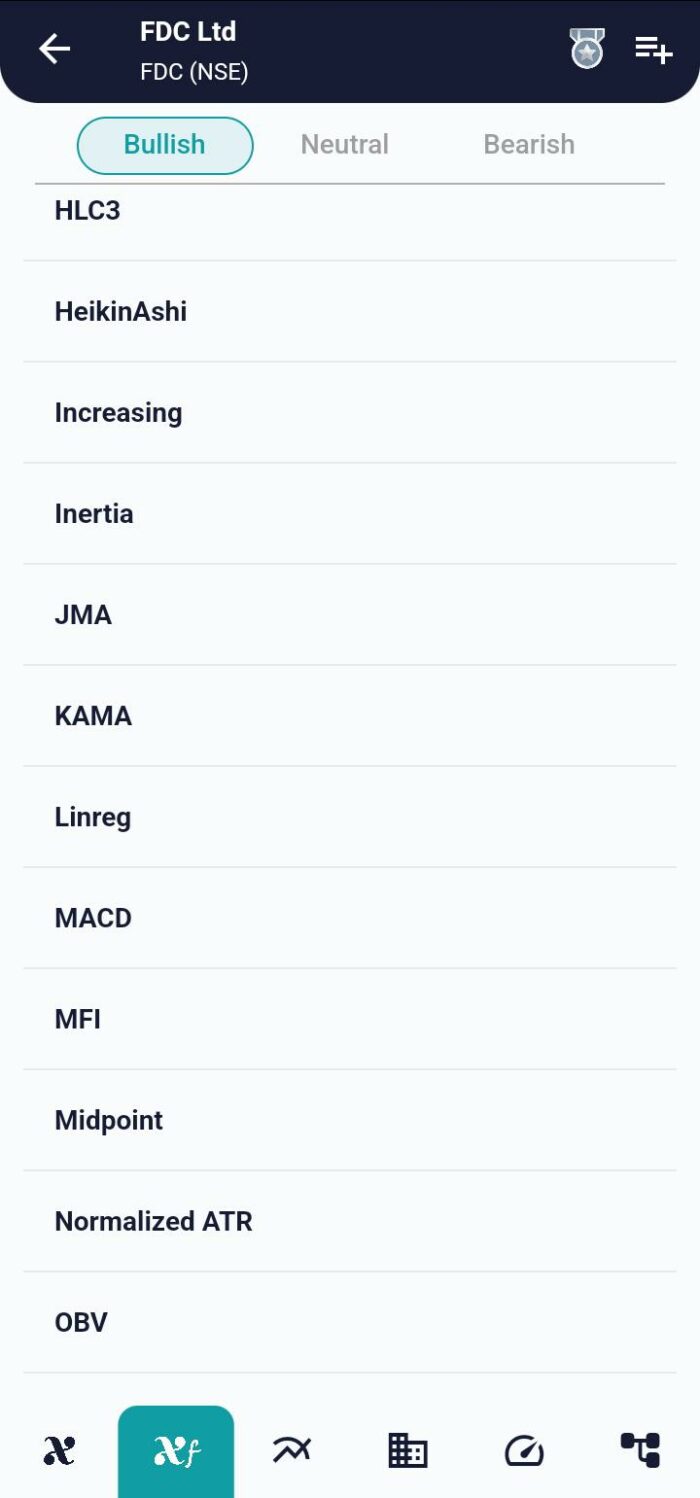
xCalData is an exceptional app available for Android devices that offers unbiased insights into stocks, allowing investors to make informed decisions. With its user-friendly interface and comprehensive features, xCalData provides a valuable resource for anyone interested in the stock market. Download the app from google play.
For Actionable Intelligence, subscribe to xCalData app on Android devices: https://tinyurl.com/downloadxCalData
Popular Posts
-
Stock of Interest . August 23, 2024
#HSCL (NSE) Stock Report | 23 Aug 2024
-
Stock of Interest . August 23, 2024
Add Zerodha trading account to xCalData
-
Stock of Interest . August 23, 2024
What is xCalData , how to use it and how accurate is it?
-
Stock of Interest . August 23, 2024
Jurik Moving Average (JMA): A Profit Trading Insight