Technical Indicator
Posted On: January 31, 2024
Managing Market Trends with Chandelier Exit: A Volatility Indicator
Traders use a variety of tools and indicators in the fast-paced world of financial markets to efficiently manage risks and make well-informed decisions. The Chandelier Exit (CE), a volatility-based technical indicator intended to pinpoint the best stop-loss exit locations for both long and short trading positions, is one such instrument. This indicator, which was created by Chuck Le Beau and made popular by Alexander Elder, is based on the idea of volatility and is meant to hold traders in a trend until a possible reversal happens.
Understanding Chandelier Exit
This derives its name from the hanging fixtures that adorn ceilings, symbolizing the indicator’s function of trailing stop-loss points. It is primarily based on the Average True Range (ATR) indicator, a measure of market volatility. The overarching goal of CE is to enhance returns in a trade by providing an effective mechanism for making stop-loss exit decisions.
How Chandelier Exit Works
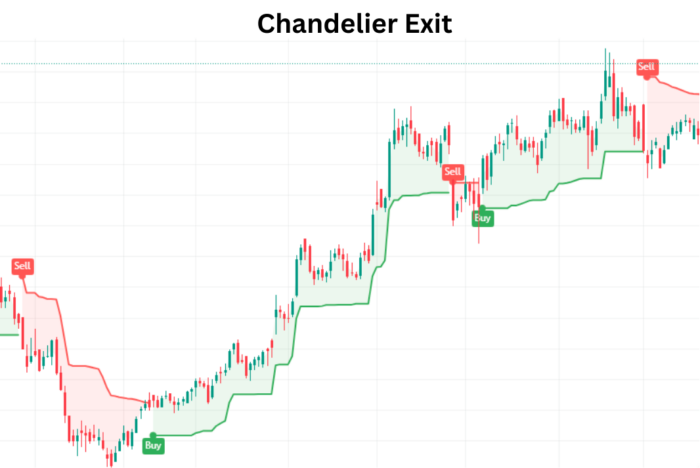
This Indicator operates on the principle that a trend reversal is likely when the price of an asset moves against the existing trend up to three times the average volatility. The indicator uses high and low prices over a defined period, incorporating ATR calculations to determine optimal exit points.
Utilizing Chandelier Exit
Traders deploy to optimize returns and manage risks based on market volatility. During periods of lower volatility, smaller trailing stop losses are set to capture maximum returns during upward trends. In contrast, higher volatility prompts the use of larger trailing stops to safeguard against choppy trading conditions and potential trend reversals.
Formula and Calculations
This Indicator involves two lines: Chandelier Exit Long and Chandelier Exit Short. The formula for these lines includes the n-day Highest High and Lowest Low, along with a multiplier based on the ATR. The calculations are as follows:
Chandelier Exit Long: n-day Highest High – ATR (n) x Multiplier
Chandelier Exit Short: n-day Lowest Low + ATR (n) x Multiplier
Where:
- N is the default unit period of 22 or the number that the trader chooses.
- The multiplier is the default 3.0 Average True Range.
Interpretations of Chandelier Exit
Chandelier Uptrend
An uptrend signifies a market where the price of a security is consistently moving upward, with each successive peak and trough higher than the previous ones. It helps identify and navigate uptrends, allowing traders to maximize returns before a potential reversal. The indicator sets a trailing stop low to secure profits during the upward trend.
Chandelier Downtrend
Conversely, a downtrend is characterized by a decline in the price of a security, marked by lower peaks and troughs. Traders use this Indicator to promptly identify and confirm downtrends, crucial for avoiding potential losses associated with continuous downtrends. The indicator can be employed alongside other tools, such as the Relative Strength Index (RSI), to make informed decisions regarding short positions.
Conclusion
In Summary, this serves as a valuable tool for traders seeking to navigate market trends and manage risks effectively. By incorporating volatility-based stop-loss strategies, traders can make informed decisions, optimize returns, and protect their investments in the dynamic landscape of financial markets.
This empowers traders to make informed decisions, unlocking the potential for identifying trend reversals and seizing opportunities in dynamic markets. Whether you are a seasoned trader or just starting, incorporating into your analytical toolkit could be a game-changer.
xCalData is an exceptional app available for Android devices that offers unbiased insights into stocks, allowing investors to make informed decisions. With its user-friendly interface and comprehensive features, xCalData provides a valuable resource for anyone interested in the stock market. Download the app from google play.
For Actionable Intelligence, subscribe to xCalData app on Android devices: https://tinyurl.com/downloadxCalData
Popular Posts
-
Stock of Interest . August 23, 2024
#HSCL (NSE) Stock Report | 23 Aug 2024
-
Stock of Interest . August 23, 2024
Add Zerodha trading account to xCalData
-
Stock of Interest . August 23, 2024
What is xCalData , how to use it and how accurate is it?
-
Stock of Interest . August 23, 2024
Jurik Moving Average (JMA): A Profit Trading Insight