Technical Indicator
Posted On: February 6, 2024
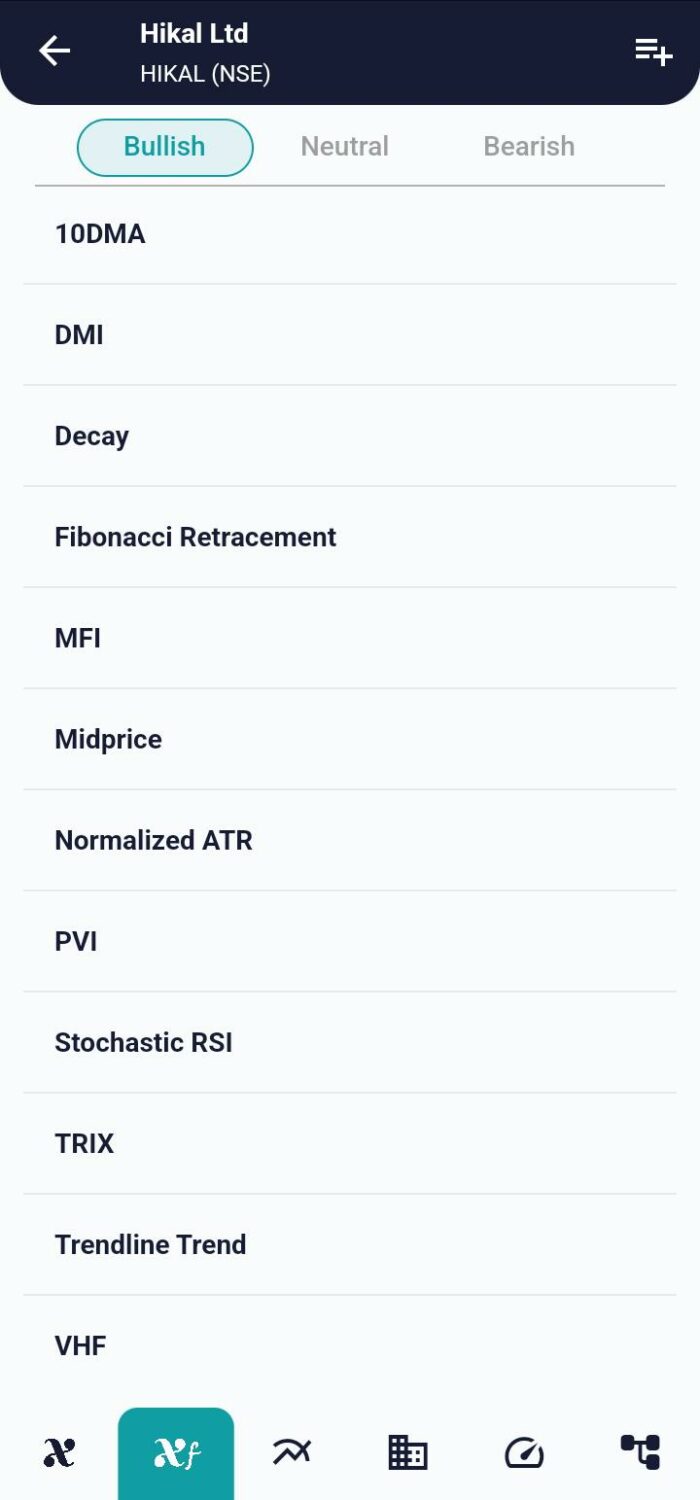
Market Equilibrium with the Midprice Indicator Mastery
Introduction:
In the intricate world of financial market analysis, traders seek valuable insights to make informed decisions. The Midprice technical indicator , a straightforward yet powerful tool, calculates the midpoint between the highest and lowest prices over a specified period. This mathematical calculation provides a unique perspective on market equilibrium, aiding traders in identifying potential trend reversals.
Understanding the Midprice Indicator:
The Midprice Indicator revolves around a simple concept – finding the midpoint between the highest and lowest prices within a designated timeframe. This indicator’s primary goal is to offer a snapshot of the equilibrium price level, providing traders with crucial information about market dynamics.
Mathematical formula:
Midprice = (Highest Price + Lowest Price) / 2
Where:
- Highest Price: The highest price reached during the specified time frame.
- Lowest Price: The lowest price reached during the specified time frame.
Elements of the Midprice Indicator:
- Calculation Formula:
- The Midprice is calculated as the midpoint between the highest and lowest prices over a specified time frame. This formula ensures that the indicator encapsulates the central price level within the chosen period.
- Equilibrium Price Insight:
- By focusing on the midpoint, the Midprice Indicator reveals a balance point where buying and selling pressures may converge. Traders leverage this information to gauge potential shifts in market sentiment.
Interpreting Midprice Signals:
- Bullish Signal:
- A bullish signal occurs when the Midprice Value crosses above its previous value. This suggests a potential uptrend, prompting traders to consider buying opportunities.
- Bearish Signal:
- Conversely, a bearish signal arises when the Midprice Value crosses below its previous value. This indicates a potential downtrend, signaling traders to explore selling opportunities.
- Hold Signal:
- If neither a bullish nor a bearish signal is detected, the Midprice Indicator assigns a “Hold” signal. This signifies a period where the market is not showing clear directional bias.
Incorporating the Midprice Indicator into Your Strategy:
- Trend Confirmation: Use Midprice signals to confirm existing trends or identify potential trend reversals.
- Support and Resistance: The Midprice serves as a dynamic reference point for intraday support and resistance levels.
- Combining with Other Indicators: Enhance the reliability of your trading decisions by combining Midprice signals with other technical indicators.
Conclusion:
The Midprice Indicator, with its simplicity and focus on market equilibrium, adds a valuable dimension to a trader’s toolkit. Whether identifying potential trend reversals or confirming existing trends, the Midprice Indicator provides critical insights into market dynamics. As you explore diverse technical indicators, consider integrating the Midprice Indicator to enhance your ability to navigate and interpret market trends effectively.
xCalData is an exceptional app available for Android devices that offers unbiased insights into stocks, allowing investors to make informed decisions. With its user-friendly interface and comprehensive features, xCalData provides a valuable resource for anyone interested in the stock market. Download the app from google play.
For Actionable Intelligence, subscribe to xCalData app on Android devices: https://tinyurl.com/downloadxCalData
Popular Posts
-
Stock of Interest . August 23, 2024
#HSCL (NSE) Stock Report | 23 Aug 2024
-
Stock of Interest . August 23, 2024
Add Zerodha trading account to xCalData
-
Stock of Interest . August 23, 2024
What is xCalData , how to use it and how accurate is it?
-
Stock of Interest . August 23, 2024
Jurik Moving Average (JMA): A Profit Trading Insight