Technical Indicator
Posted On: February 6, 2024
Mastering MACD: A Comprehensive Guide to the Moving Average Convergence Divergence Indicator
Introduction:
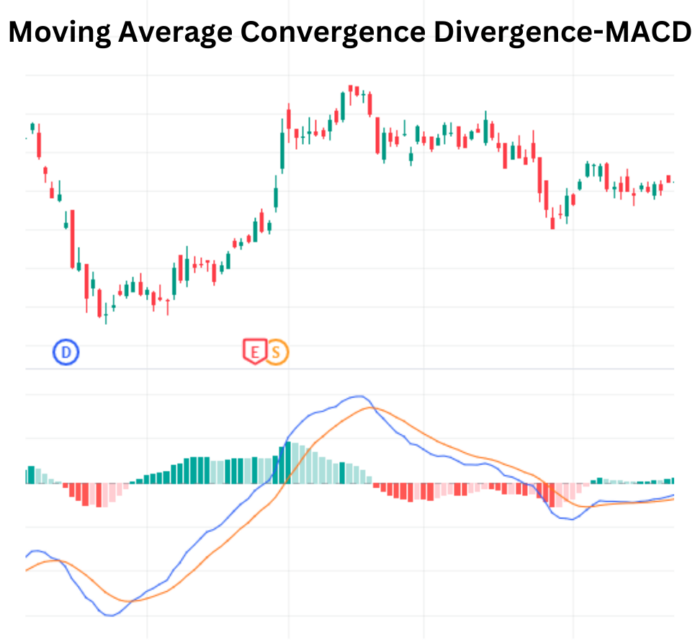
The Moving Average Convergence Divergence (MACD) is a powerful trend-following momentum technical indicator that unveils the relationship between two exponential moving averages (EMAs) of a security’s price. Developed to provide insights into market trends, MACD has become a staple tool for traders worldwide.
Understanding Moving Average Convergence Divergence Calculation:
The MACD line itself is derived by subtracting the 26-period EMA from the 12-period EMA. This fundamental calculation sets the foundation for assessing market momentum and potential buy or sell signals.
Components of MACD:
A critical component of Moving Average Convergence Divergence is the signal line, a nine-day EMA of the MACD line. Traders use the interplay between the MACD line and the signal line to trigger buy or sell decisions. Buying is often signaled when the MACD line crosses above the signal line, while selling opportunities arise when the MACD line falls below the signal line.
Interpreting MACD:
MACD provides valuable insights through various interpretations. The indicator is particularly effective when applied to daily periods, with default settings of 26/12/9 days. Traders can gauge overbought or oversold conditions, determine the strength of a directional move, and anticipate potential price reversals.
Technical Signals:
Moving Average Convergence Divergence generates technical signals primarily through crossovers. A bullish signal occurs when the MACD line crosses above the signal line, prompting a buy recommendation. Conversely, a bearish signal arises when the MACD line crosses below the signal line, signaling a sell or short opportunity.
Divergences and Reversals:
One of MACD’s strengths lies in detecting divergences, such as when a new high in price is not confirmed by a new high in MACD, and vice versa. These divergences can indicate potential trend failures and reversals, guiding traders in making informed decisions.
Confirmation and Best Practices:
For optimal accuracy, traders are advised to wait for three or four days after a signal line crossover to confirm its legitimacy and avoid false moves.
Conclusion:
Mastering MACD empowers traders to navigate dynamic markets with confidence. By understanding its calculation, components, and interpretation, traders can harness the full potential of this versatile indicator to make well-informed decisions and stay ahead in their trading endeavors.
xCalData is an exceptional app available for Android devices that offers unbiased insights into stocks, allowing investors to make informed decisions. With its user-friendly interface and comprehensive features, xCalData provides a valuable resource for anyone interested in the stock market. Download the app from google play.
For Actionable Intelligence, subscribe to xCalData app on Android devices: https://tinyurl.com/downloadxCalData
Popular Posts
-
Stock of Interest . August 23, 2024
#HSCL (NSE) Stock Report | 23 Aug 2024
-
Stock of Interest . August 23, 2024
Add Zerodha trading account to xCalData
-
Stock of Interest . August 23, 2024
What is xCalData , how to use it and how accurate is it?
-
Stock of Interest . August 23, 2024
Jurik Moving Average (JMA): A Profit Trading Insight