Technical Indicator
Posted On: February 6, 2024
Mastering Market Analysis with the Money Flow Index (MFI)
Introduction:
In the vast landscape of technical indicator, the Money Flow Index (MFI) stands out as a unique oscillator that combines both price and volume data. This powerful tool aids traders in identifying overbought or oversold conditions in an asset, offering valuable insights into potential trend changes. Often referred to as the volume-weighted Relative Strength Index (RSI), the MFI provides a comprehensive view of market dynamics.
Understanding the Money Flow Index (MFI):
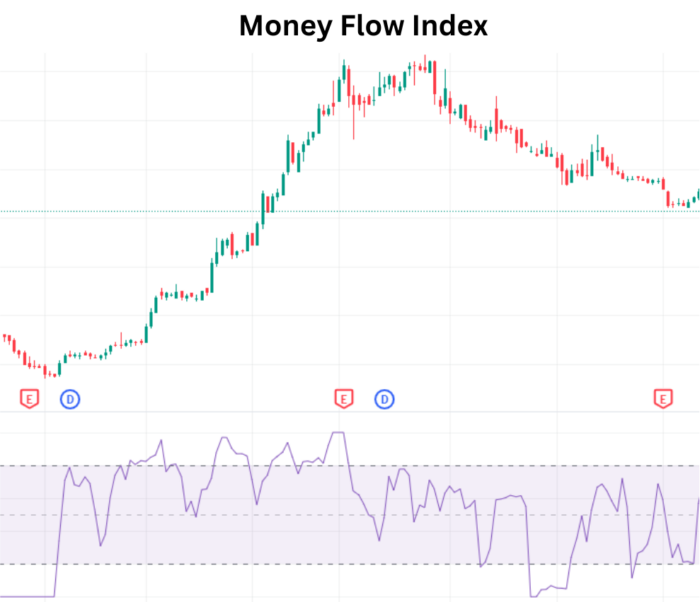
The Money Flow Index oscillates between 0 and 100, utilizing a formula that incorporates both price and volume data. Unlike traditional oscillators, such as the RSI, the MFI’s integration of volume enriches its ability to generate robust signals, making it a go-to indicator for traders seeking a holistic approach to market analysis.
Interpretation of Money Flow Index:
- Overbought and Oversold Signals: An MFI reading above 80 indicates overbought conditions, suggesting a potential reversal may be imminent. Conversely, an MFI reading below 20 signals oversold conditions, hinting at a possible upward reversal.
- Volume-Weighted Analysis: By factoring in both price and volume, the MFI provides a more nuanced perspective, capturing the interplay between market strength and volume trends.
- Divergence Recognition: The MFI is adept at identifying divergences between the indicator and price. For instance, a rising MFI alongside falling or flat prices may foreshadow an upcoming price increase.
The Money Flow Index Formulas:
- Money Flow Index (MFI): MFI = 100 – (100 / (1 + Money Flow Ratio))
- Money Flow Ratio: Money Flow Ratio = 14 Period Positive Money Flow / 14 Period Negative Money Flow
- Raw Money Flow: Raw Money Flow = Typical Price * Volume Typical Price = (High + Low + Close) / 3
Incorporating MFI into Your Trading Strategy:
- Overbought and Oversold Zones: Utilize MFI readings above 80 and below 20 to identify potential reversal points.
- Confirmation with Price Trends: Look for confirmation of MFI signals with corresponding price movements to enhance the reliability of your trading decisions.
- Divergence Analysis: Pay attention to divergences between MFI and price, as they can serve as early indicators of trend changes.
Conclusion:
The Money Flow Index (MFI) is a versatile and insightful tool that empowers traders with a holistic understanding of market conditions. By integrating both price and volume data, the MFI offers a nuanced approach to technical analysis, making it an invaluable asset in your trading toolkit. As you navigate the markets, consider harnessing the power of the MFI to elevate your trading strategies and decision-making processes.
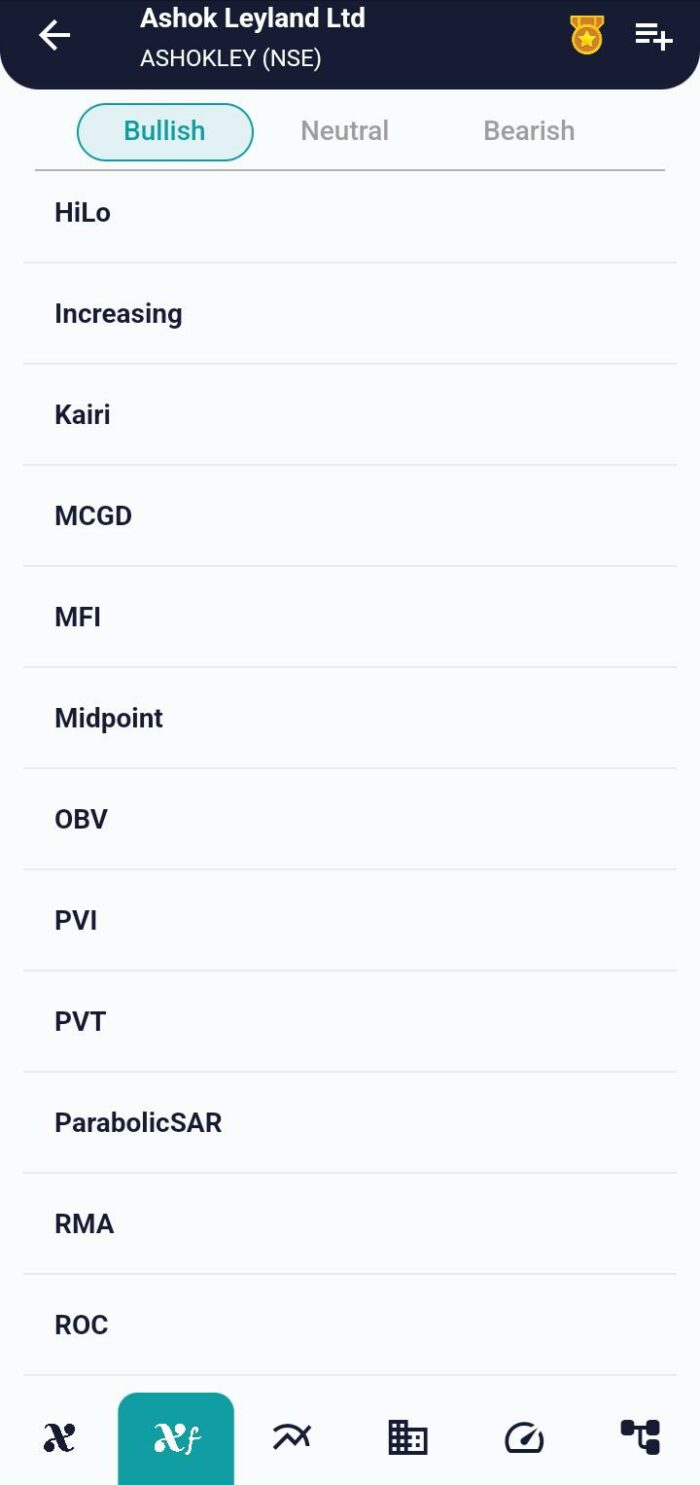
xCalData is an exceptional app available for Android devices that offers unbiased insights into stocks, allowing investors to make informed decisions. With its user-friendly interface and comprehensive features, xCalData provides a valuable resource for anyone interested in the stock market. Download the app from google play.
For Actionable Intelligence, subscribe to xCalData app on Android devices: https://tinyurl.com/downloadxCalData
Popular Posts
-
Stock of Interest . August 23, 2024
#HSCL (NSE) Stock Report | 23 Aug 2024
-
Stock of Interest . August 23, 2024
Add Zerodha trading account to xCalData
-
Stock of Interest . August 23, 2024
What is xCalData , how to use it and how accurate is it?
-
Stock of Interest . August 23, 2024
Jurik Moving Average (JMA): A Profit Trading Insight