Technical Indicator
Posted On: January 30, 2024
Mastering Market Movements: A Deep Dive into Bollinger Bands Strategy for Trading Success
In the world of technical analysis, traders and investors often turn to a variety of tools to gain insights into market trends, reversals, and potential entry or exit points. One such powerful tool is the Bollinger Bands technical indicator, a creation of renowned technical trader John Bollinger. These bands offer a unique perspective on a security’s price movements, helping market participants identify potential overbought or oversold conditions.
Understanding Bollinger Bands:
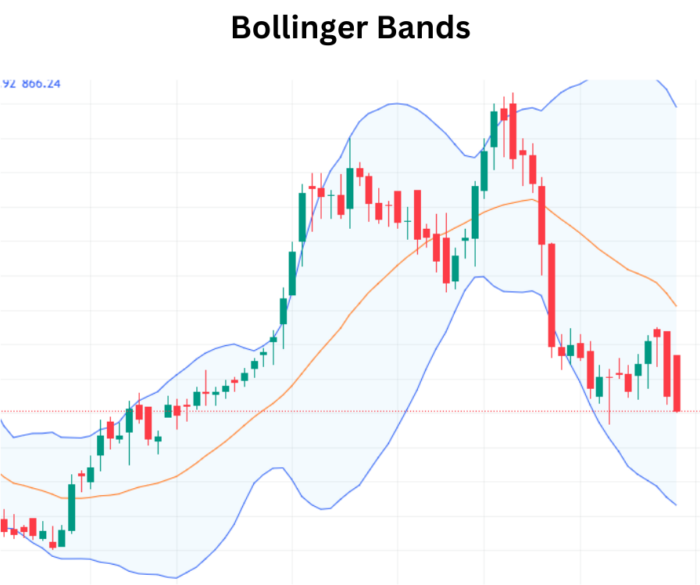
Bollinger Bands consist of a set of trendlines plotted around a simple moving average (SMA) of a security’s price. The key feature of these bands is that they are set at two standard deviations, both positively and negatively, from the SMA. This creates an upper band (BOLU) and a lower band (BOLD), providing a dynamic channel that adapts to price volatility. Typically, the standard parameters involve a 20-day SMA and two standard deviations, but users have the flexibility to adjust these settings based on their preferences and analysis needs.
The Mathematical Foundation:
The mathematical formula for Bollinger Bands involves the calculation of the upper and lower bands:
Bollinger Band Upper =MA(TP, n)+m∗σ[TP, n]
Bollinger Band Lower =MA(TP, n)−m∗σ[TP, n]
Where:
- MA: Moving Average
- TP (Typical Price): TP (typical price)=(High + Low + Close)÷3
- n: Number of days in the smoothing period (typically 20)
- m: Number of standard deviations (typically 2)
- σ[TP, n]: Standard Deviation over the last n periods of TP
Interpreting Bollinger Bands Signals:
Bullish Signals:
- If the previous close breaks below the lower Bollinger Band, and the current price remains inside the lower band, it’s considered a bullish signal. This suggests that the security may have been oversold, and a potential reversal or upward movement could be underway.
Bearish Signals:
- When the price touches or exceeds the upper Bollinger Band, it’s seen as a bearish signal. This indicates potential overbought conditions, suggesting that a reversal or downward movement might be in the cards.
Real-World Application:
Let’s consider a practical scenario where a stock exhibits heightened volatility, and traders are keen on identifying periods of robust momentum. Applying the Bollinger Band, traders observe the Close Price crossing above the upper band from below, indicating an uptrend. This signals potential buying opportunities. Conversely, if the Close Price crosses the upper band and lower band from above, it suggests a downtrend, prompting traders to explore potential selling opportunities.
Application and Insights:
The practical application of Bollinger Bands lies in providing traders with a visual representation of price volatility and potential reversal points. The “squeeze” phenomenon, where the bands constrict, often precedes periods of low volatility, signaling potential future increased volatility and trading opportunities. While breakouts beyond the bands are considered significant events, they do not offer directional cues, emphasizing the importance of combining Bollinger Bands insights with other forms of analysis.
Conclusion:
Incorporating Bollinger Bands into your technical analysis toolkit can enhance your ability to identify potential entry and exit points, understand market volatility, and navigate market trends more effectively. As with any tool, it’s crucial to combine Bollinger Bands insights with other forms of analysis for a comprehensive trading strategy.
As with any technical indicator, it’s crucial for traders to integrate the Bollinger Band into a comprehensive analysis, considering it alongside other indicators and market factors. This approach enhances the accuracy of trading decisions and provides a nuanced understanding of market dynamics.
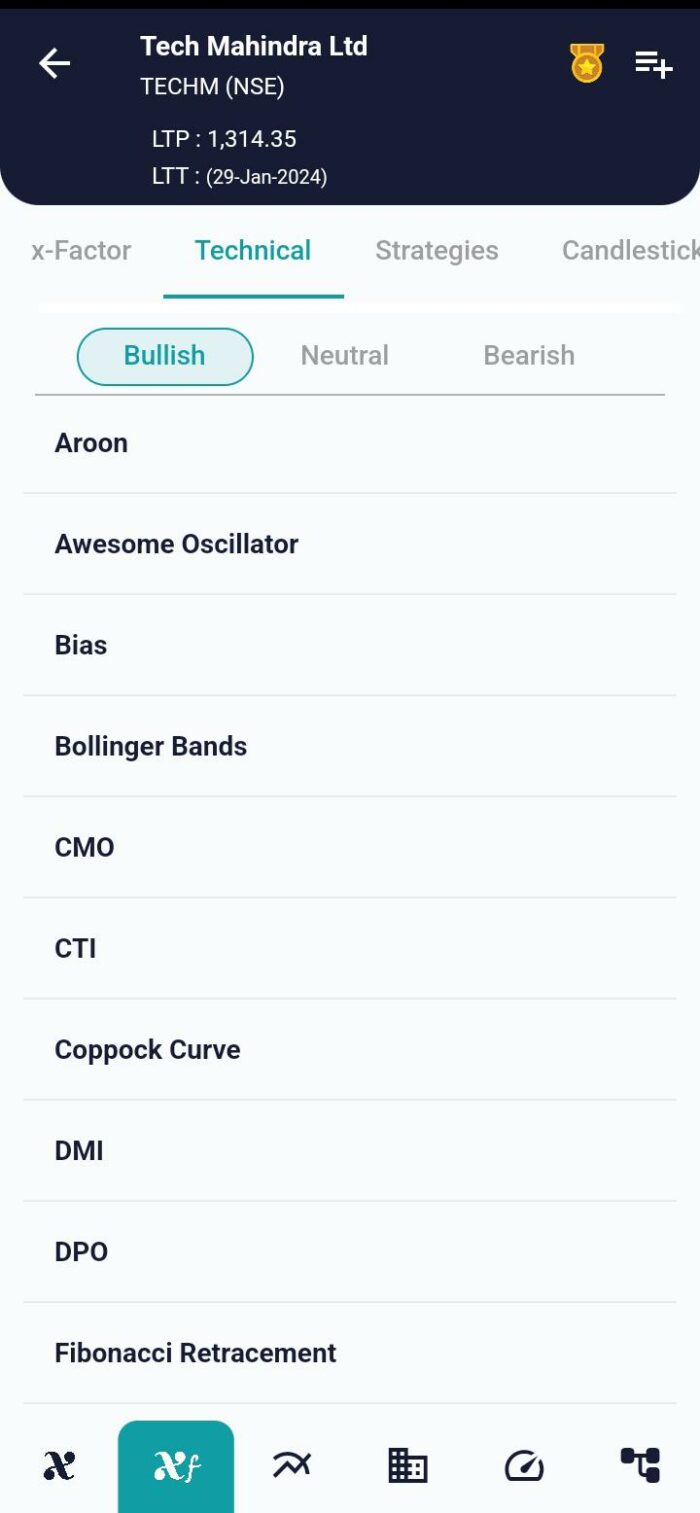
xCalData is an exceptional app available for Android devices that offers unbiased insights into stocks, allowing investors to make informed decisions. With its user-friendly interface and comprehensive features, xCalData provides a valuable resource for anyone interested in the stock market. Download the app from google play.
For Actionable Intelligence, subscribe to xCalData app on Android devices: https://tinyurl.com/downloadxCalData
Popular Posts
-
Stock of Interest . August 23, 2024
#HSCL (NSE) Stock Report | 23 Aug 2024
-
Stock of Interest . August 23, 2024
Add Zerodha trading account to xCalData
-
Stock of Interest . August 23, 2024
What is xCalData , how to use it and how accurate is it?
-
Stock of Interest . August 23, 2024
Jurik Moving Average (JMA): A Profit Trading Insight