Technical Indicator
Posted On: February 5, 2024
Mastering Market Movements with KAMA -Kaufman’s Adaptive Moving Average
Introduction to KAMA
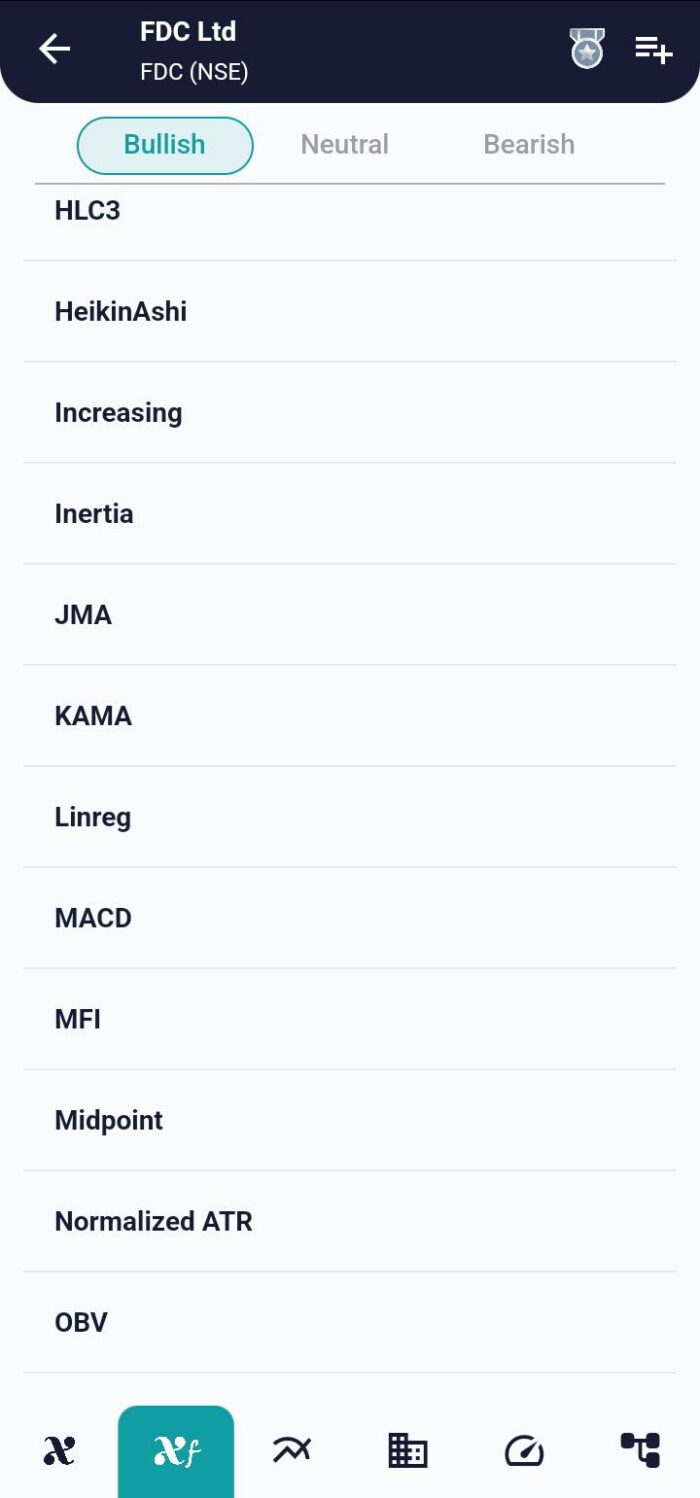
Developed by Perry J. Kaufman, the Kaufman’s Adaptive Moving Average (KAMA) is a sophisticated technical indicator designed to adapt to varying market conditions. It dynamically adjusts its smoothing period, providing traders with a powerful tool to navigate both trending and choppy markets effectively. Lets see about this indicator with xCalData app.
Understanding KAMA Calculation
The calculation of Kaufman’s Adaptive Moving Average involves three key components:
Calculating the Kaufman Adaptive Moving Average
When calculating Kaufman’s Adaptive Moving Average, the following standard settings are used:
- 10 – Number of periods for the Efficiency Ratio
- 2 – Number of periods for the fastest exponential moving average
- 30 – Number of periods for the slowest exponential moving average
To obtain the value of the KAMA, you must first calculate the value of the Efficiency Ratio and the Smoothing Constant.
Efficiency Ratio (ER)
The efficiency ratio shows the efficiency of price changes. It fluctuates between 1 and 0. When the price remains unchanged over 10 periods, the ER is zero. However, if the price moves up or down 10 consecutive periods, the ER moves to 1. It is calculated by dividing the absolute difference between the current price and the price at the beginning of the period by the sum of the absolute difference between each pair of closes during the period. The formula for calculating ER is as follows:
ER = Change/volatility
Change = Absolute Value [Close – Close (past 10 periods)]
Volatility Sum = 10 periods (Close – Prior Close)
Smoothing Constant (SC)
The smoothing constant is calculated for each period. It uses the value obtained for efficiency ratio and two smoothing constants as follows:
SC= [ER x (Fastest SC – Slowest SC) + Slowest SC]2
SC= [ER x (2/ (2+1) – 2/(30+1)) +2/ (30+1)]2
In the above equation, (2/30+1) is the smoothing constant for the recommended 30-period EMA. Also, the slowest smoothing constant is the SC for the slowest 30-period EMA, while the fastest smoothing constant is the SC for shorter 2-period EMA.
KAMA
After getting the values of the efficiency function and smoothing constant, you can now calculate the Kaufman’s Adaptive Moving Average indicator values. The formula is as follows:
KAMAi = KAMAi-1 + SC x (Price – KAMA i-1)
Where:
- KAMAi is the value of the current period
- KAMAi-1 is the value of the period preceding the period being calculated.
- Price is the source price for the period being calculated.
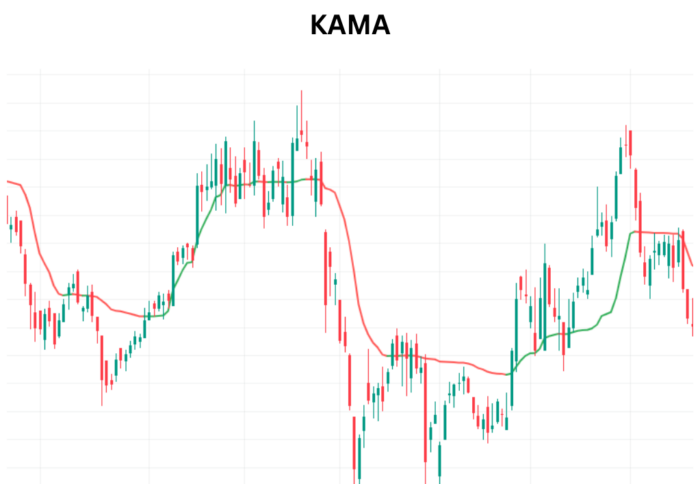
Interpreting Kaufman’s Adaptive Moving Average Values
- Rising KAMA: Indicates a potential uptrend.
- Falling KAMA: Suggests a potential downtrend.
- Volatility Impact: KAMA becomes more responsive during high volatility and smoother during low volatility.
Incorporating Kaufman’s Adaptive Moving Average into Trading Strategies
1. Trend Identification:
- Utilize Kaufman’s Adaptive Moving Average to identify the prevailing market trend based on its direction.
2. Dynamic Support/Resistance:
- Kaufman’s Adaptive Moving Average can act as dynamic support during uptrends and resistance during downtrends.
3. Signal Generation:
- Generate buy signals when prices cross above Kaufman’s Adaptive Moving Average and sell signals when prices cross below KAMA.
Conclusion
Kaufman’s Adaptive Moving Average (KAMA) is a valuable addition to any trader’s toolkit, offering adaptability to diverse market conditions. By understanding its calculation, interpreting its values, and incorporating it into your trading strategies, you can enhance your ability to spot trends and make informed decisions. Explore and experiment with Kaufman’s Adaptive Moving Average to unlock its full potential in mastering market trends. Happy trading!
xCalData is an exceptional app available for Android devices that offers unbiased insights into stocks, allowing investors to make informed decisions. With its user-friendly interface and comprehensive features, xCalData provides a valuable resource for anyone interested in the stock market. Download the app from google play.
For Actionable Intelligence, subscribe to xCalData app on Android devices: https://tinyurl.com/downloadxCalData
Popular Posts
-
Stock of Interest . August 23, 2024
#HSCL (NSE) Stock Report | 23 Aug 2024
-
Stock of Interest . August 23, 2024
Add Zerodha trading account to xCalData
-
Stock of Interest . August 23, 2024
What is xCalData , how to use it and how accurate is it?
-
Stock of Interest . August 23, 2024
Jurik Moving Average (JMA): A Profit Trading Insight