Technical Indicator
Posted On: February 8, 2024
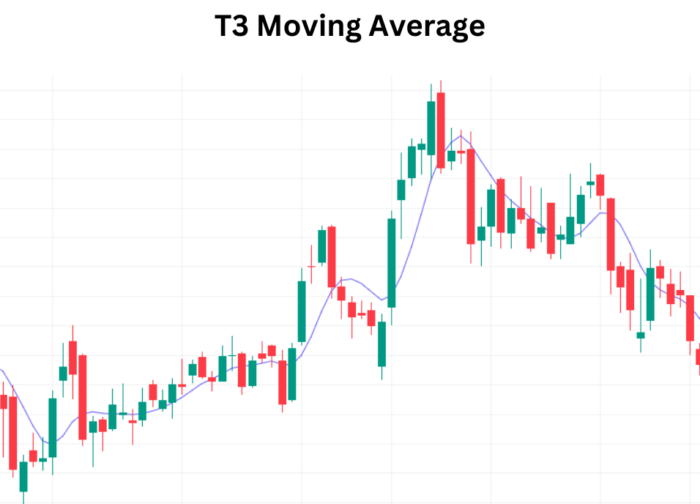
Mastering Market Trends T3 Moving Average
Unleashing the Power of T3 Moving Average:
The T3 Moving Average (T3 MA) stands out as a superior technical indicator in the realm of technical analysis, offering enhanced smoothness, responsiveness, and performance, especially in ranging market conditions. This guide unveils the strengths and nuances of T3 MA, shedding light on its advantages and considerations for generating buy or sell signals.
Understanding T3 Moving Average:
- Smoother and More Responsive:
- T3 MA outshines traditional moving averages with its superior smoothness and responsiveness.
- It excels in capturing market trends, especially in ranging conditions.
- Overshooting Dynamics:
- T3 MA, in its attempt to align with current market conditions, may overshoot the price.
- Traders should be mindful of this characteristic while interpreting T3 MA movements.
- Weighted Sum Technique:
- T3 MA is a weighted sum of a single EMA, double EMA, triple EMA, and so on.
- This technique contributes to the gradual plotting of curves with reduced lag.
Mathematical formula:
T3 = c1*e6 + c2*e5 + c3*e4 + c4*e3
where:
– e1 = EMA (Close, Period)
– e2 = EMA (e1, Period)
– e3 = EMA (e2, Period)
– e4 = EMA (e3, Period)
– e5 = EMA (e4, Period)
– e6 = EMA (e5, Period)
– a is the volume factor; default value is 0.7 but 0.618 can also be used
– c1 = – a^3
– c2 = 3*a^2 + 3*a^3
– c3 = – 6*a^2 – 3*a – 3*a^3
– c4 = 1 + 3*a + a^3 + 3*a^2
Interpretation for Trading Signals:
- Bullish Signal:
- A change in T3 value into a rising trend serves as a buy signal.
- Bullish signals indicate a potential upward market movement.
- Bearish Signal:
- When the T3 value is falling, it generates a sell signal.
- Bearish signals suggest a potential downward market movement.
Trade Execution and Decision-Making:
- Buy Signal Execution:
- Traders may consider initiating long positions when T3 indicates a rising trend.
- Confirmation from other indicators and comprehensive market analysis strengthens the buy decision.
- Sell Signal Execution:
- Entering short positions could be contemplated when T3 shows a falling trend.
- Confirmation from additional indicators and thorough analysis supports the sell decision.
End of Trend Indication:
- Penetration and Lack of Reversal:
- A confirmed penetration of the T3 MA without a subsequent reversal may signal the end of a trend.
- Traders should be attentive to such indications for potential trend transitions.
Conclusion:
The T3 Moving Average emerges as a powerful ally for traders, providing a smoother and more responsive alternative to traditional moving averages. While its overshooting nature requires careful consideration, the weighted sum technique contributes to its effectiveness in trend identification. Utilizing T3 MA in conjunction with a comprehensive trading strategy and market analysis enhances its prowess. Traders navigating the dynamic landscape of financial markets can leverage the T3 Moving Average to decipher trends and make well-informed decisions.
xCalData is an exceptional app available for Android devices that offers unbiased insights into stocks, allowing investors to make informed decisions. With its user-friendly interface and comprehensive features, xCalData provides a valuable resource for anyone interested in the stock market. Download the app from google play.
For Actionable Intelligence, subscribe to xCalData app on Android devices: https://tinyurl.com/downloadxCalData
Popular Posts
-
Stock of Interest . August 23, 2024
#HSCL (NSE) Stock Report | 23 Aug 2024
-
Stock of Interest . August 23, 2024
Add Zerodha trading account to xCalData
-
Stock of Interest . August 23, 2024
What is xCalData , how to use it and how accurate is it?
-
Stock of Interest . August 23, 2024
Jurik Moving Average (JMA): A Profit Trading Insight