Technical Indicator
Posted On: January 29, 2024
Mastering Market Trends: The 30 DMA Crossover Decoded
In the fast-paced arena of financial markets, traders are in a constant quest for effective tools that can decipher market trends. The 30 DMA Crossover (30-day Moving Average) stands out as a significant indicator, providing essential signals for potential bullish or bearish movements. In this comprehensive blog post, we delve into the intricacies of the 30 DMA Crossover, exploring its definition, calculations, and practical applications within the xCalData app.
Understanding the 30 DMA Crossover
Definition:
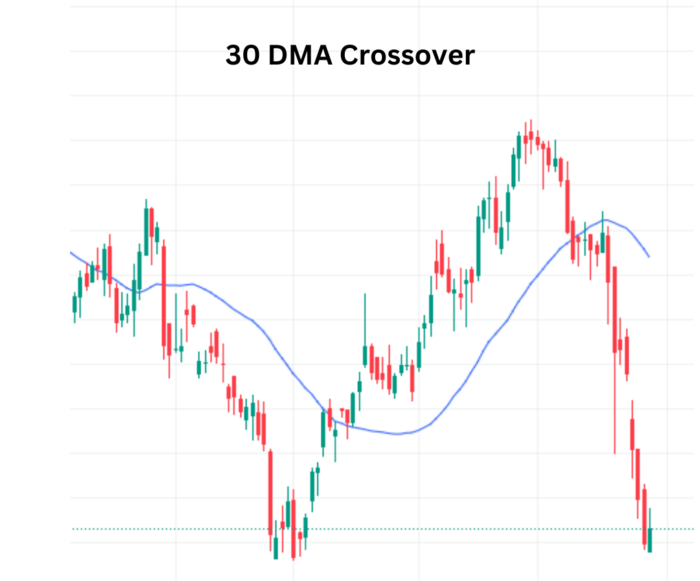
The 30 DMA Crossover is technical indicator that centered around the relationship between the current price of an asset and its 30-day Moving Average. Functioning as a trend-following indicator, the 30 DMA smoothens out price data over a 30-day period, offering a clearer perspective on the prevailing trend. Simply put, when the current price is above the 30 DMA, it signals a bullish trend, and when it’s below, it suggests a bearish trend.
Calculations:
The 30 DMA is calculated by summing up the closing prices of the last 30 days and dividing the result by 30. This moving average adapts dynamically, adjusting as each new day’s data is added while removing the oldest day. The crossover occurs when the current price intersects either above or below this 30 DMA line.
30DMA=(Sum of Closing Prices of Last 30Days)/30
Implementing the 30 DMA Crossover Technical Indicator
Bullish Signal:
A bullish signal is generated when the current price of an asset moves above the 30 DMA. This suggests that recent price movements are stronger than the average of the past 30 days, indicating potential upward momentum. Traders often interpret this as a buying opportunity, anticipating further price appreciation.
Bearish Signal:
Conversely, a bearish signal emerges when the current price falls below the 30 DMA. This implies that recent price movements are weaker than the average of the past 30 days, hinting at potential downward pressure. Traders may perceive this as a signal to consider selling positions or even initiating short positions.
Significance of the 30 DMA Crossover Technical Indicator
Trend Confirmation:
The 30 DMA Crossover serves as a confirmation tool for prevailing trends. Traders can use this indicator to validate whether the current price movement aligns with the broader trend suggested by the 30 DMA.
Adaptability:
The technical indicator’s dynamic nature enables it to quickly adapt to changing market conditions. This responsiveness makes it valuable for traders looking to stay attuned to short to medium-term trends.
Risk Management:
By incorporating the 30 DMA Crossover technical indicator into their toolkit, traders gain a risk management tool. It helps in identifying potential trend reversals, allowing for timely adjustments to trading strategies.
Real-World Application
Consider a hypothetical scenario where a stock has been consistently trading above the 30 DMA. Traders observing this alignment might interpret it as a bullish signal, indicating a sustained uptrend. Conversely, if the stock’s price consistently falls below the 30 DMA, it could be seen as a bearish signal, suggesting a potential downtrend.
Conclusion: Navigating Trends with Precision
In the dynamic realm of financial markets, precision is paramount, and the 30 DMA Crossover technical indicator stands as a testament to this. By distilling complex price movements into a clear signal based on the interaction with a 30-day Moving Average, traders gain a valuable tool for trend identification. As with any technical tool, it’s essential for traders to conduct thorough analyses, considering additional indicators and market factors.
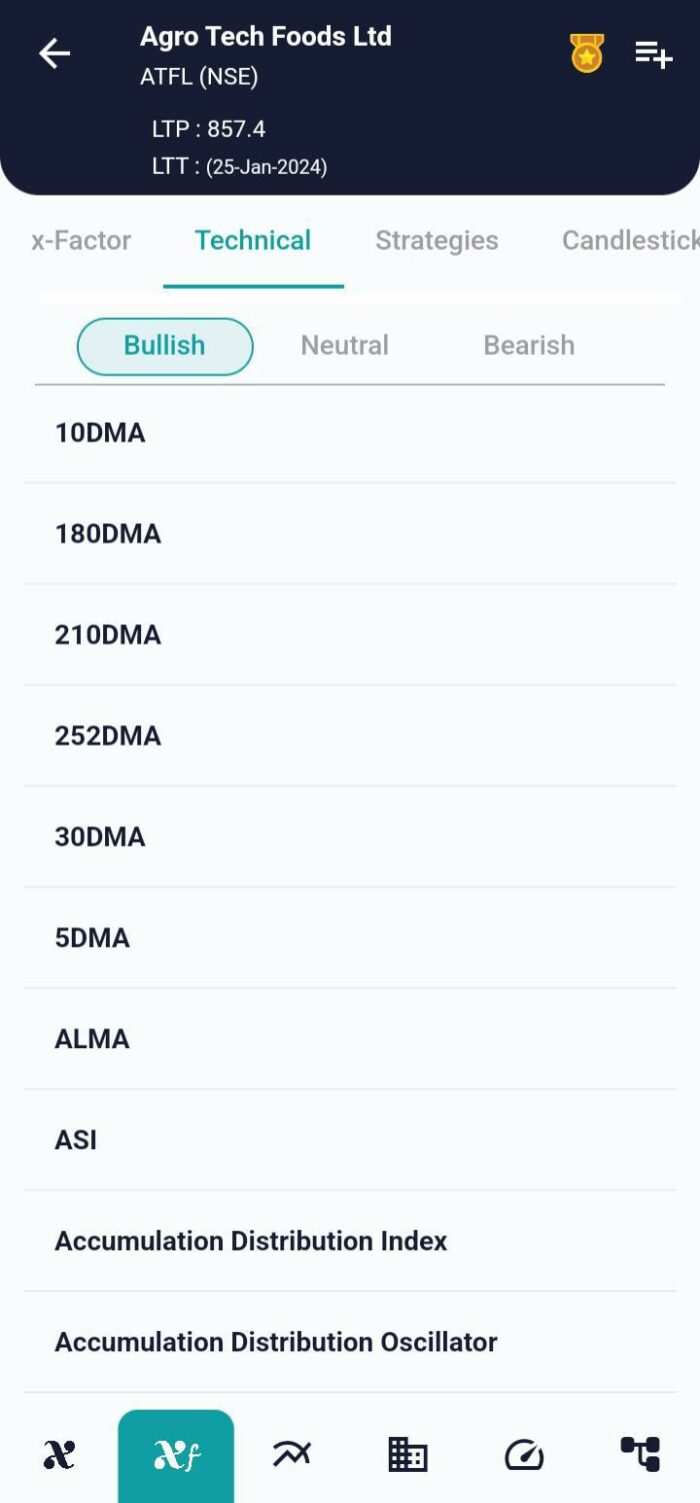
The xCalData app, available for Android devices, offers an exceptional platform for unbiased insights into stocks, allowing investors to make informed decisions. With its user-friendly interface and comprehensive features, xCalData provides a valuable resource for anyone interested in the stock market. Download the app from Google Play.
For Actionable Intelligence, subscribe to xCalData app on Android devices: https://tinyurl.com/downloadxCalData
Popular Posts
-
Stock of Interest . August 23, 2024
#HSCL (NSE) Stock Report | 23 Aug 2024
-
Stock of Interest . August 23, 2024
Add Zerodha trading account to xCalData
-
Stock of Interest . August 23, 2024
What is xCalData , how to use it and how accurate is it?
-
Stock of Interest . August 23, 2024
Jurik Moving Average (JMA): A Profit Trading Insight