Technical Indicator
Posted On: February 8, 2024
Mastering Market Trends with the Supertrend Indicator
Introduction:
The Supertrend technical indicator , developed by Olivier Seban, is a powerful tool for traders and investors seeking to identify and follow market trends. In this comprehensive guide, we will explore the key aspects of the Supertrend Indicator, including its calculation, interpretation, and practical application in various markets.
Key Takeaways:
- Identification of Market Trends:
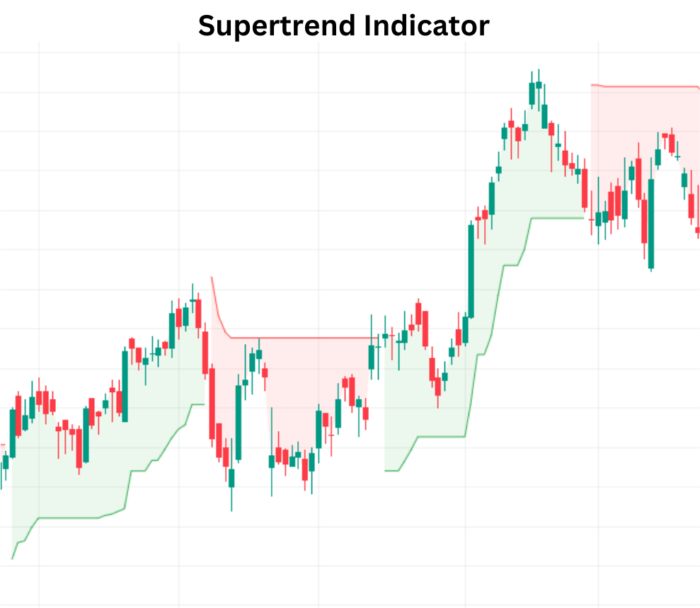
- The Supertrend Indicator assists in identifying market trends by plotting a dynamic support or resistance line on the price chart.
- When the price is above the line, it indicates an upward trend (buying opportunity), and when below, a downward trend (selling opportunity).
- Calculation Formula:
- The Supertrend line is calculated by adjusting the asset’s closing price with a value derived from multiplying the Average True Range (ATR) and a specified multiplier.
- Formula: Supertrend = (High + Low) / 2 + (Multiplier) * (ATR)
- Adaptability to Volatility:
- The inclusion of ATR in the calculation makes the Supertrend Indicator adaptable to different market conditions and asset types.
- Traders can apply the indicator to various time frames, from intraday to daily or weekly charts.
Understanding the Supertrend Indicator:
- Interpreting the Indicator:
- A bullish trend is indicated when the price is above the Supertrend line, signaling a buying opportunity.
- A bearish trend is suggested when the price is below the Supertrend line, indicating a selling opportunity.
- Trend Reversals:
- Changes in the Supertrend line’s direction relative to the asset price may signal trend reversals.
- Traders can use these reversals as opportunities to enter or exit positions.
- Multiplier Adjustment:
- Traders can adjust the sensitivity of the indicator by modifying the multiplier.
- A higher multiplier reduces sensitivity, providing fewer but potentially more reliable signals.
- A lower multiplier increases sensitivity, offering quicker signals but with a higher risk of false positives.
Effective Utilization and Considerations:
- Strengths and Limitations:
- The Supertrend Indicator is dynamic and effective in recognizing the general direction of a trend.
- Combining it with other fundamental and technical analysis indicators enhances overall strategy development.
- Dynamic Adaptation to Market Conditions:
- The indicator’s responsiveness to market volatility ensures adaptability to changing conditions.
- Traders can fine-tune their strategies based on the prevailing market environment.
Conclusion:
Mastering the Super trend Indicator empowers traders to navigate market trends with precision. By understanding its calculation, interpretation, and nuances, traders can integrate this tool into their analytical toolkit, enhancing their ability to make informed decisions. While the Supertrend Indicator is a valuable standalone tool, its true potential is realized when combined with complementary indicators and a comprehensive trading strategy.
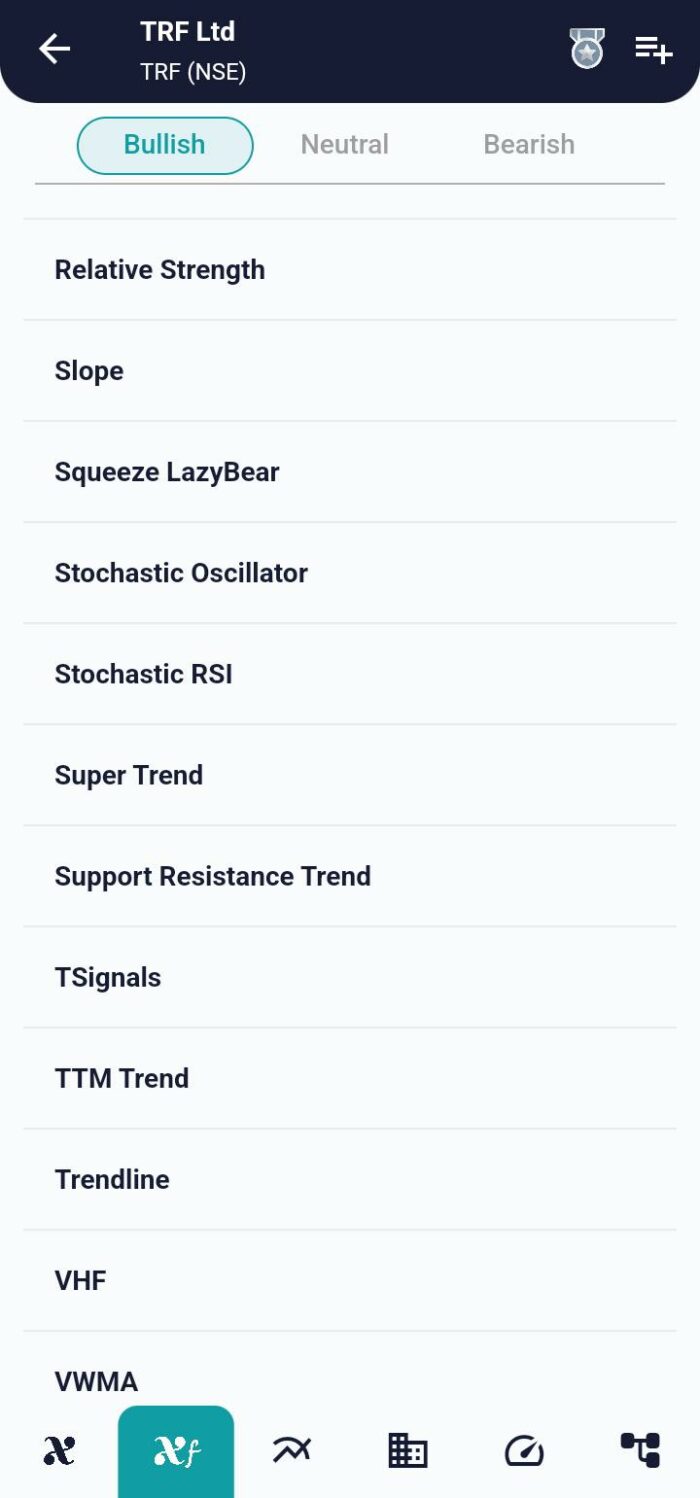
xCalData is an exceptional app available for Android devices that offers unbiased insights into stocks, allowing investors to make informed decisions. With its user-friendly interface and comprehensive features, xCalData provides a valuable resource for anyone interested in the stock market. Download the app from google play.
For Actionable Intelligence, subscribe to xCalData app on Android devices: https://tinyurl.com/downloadxCalData
Popular Posts
-
Stock of Interest . August 23, 2024
#HSCL (NSE) Stock Report | 23 Aug 2024
-
Stock of Interest . August 23, 2024
Add Zerodha trading account to xCalData
-
Stock of Interest . August 23, 2024
What is xCalData , how to use it and how accurate is it?
-
Stock of Interest . August 23, 2024
Jurik Moving Average (JMA): A Profit Trading Insight