Technical Indicator
Posted On: February 7, 2024
Mastering Rate-of-Change (ROC) Indicator: A Comprehensive Guide
Introduction:
The Rate-of-Change (ROC) indicator, often referred to as Momentum, is a powerful tool in technical analysis that focuses exclusively on measuring momentum. Developed to assess the speed and magnitude of price movements, ROC provides traders with valuable insights into the strength of a trend. This comprehensive guide explores the intricacies of the ROC indicator, its calculation, and how traders can leverage it to make informed decisions in the dynamic world of financial markets.
Understanding Rate-of-Change (ROC) Indicator:
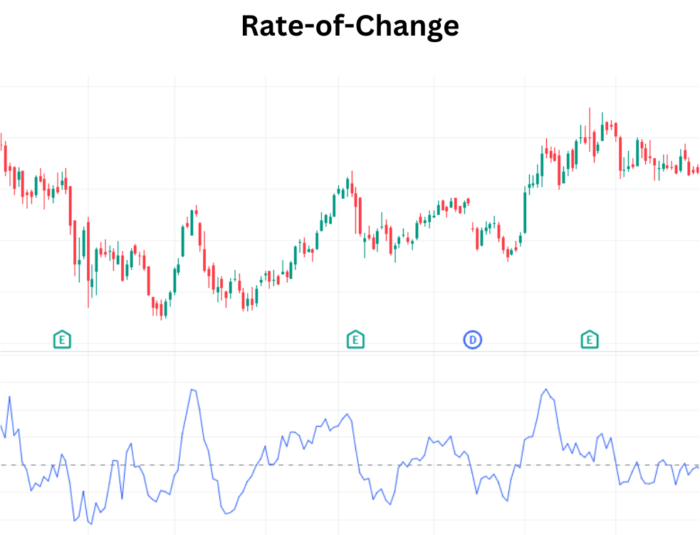
The Rate-of-Change indicator is classified as an oscillator and is particularly adept at capturing the momentum of price movements. By comparing the current price to the price “n” periods ago, ROC identifies shifts in momentum and visualizes them on an oscillator that oscillates above and below the zero line. Traders commonly use Rate-of-Change to detect the acceleration or deceleration of price trends.
Calculation of Rate-of-Change (ROC):
The calculation of ROC involves straightforward steps:
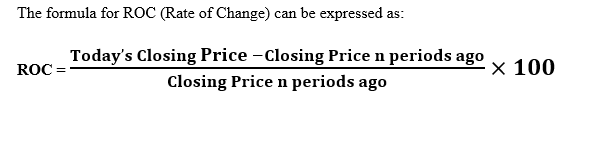
The resulting value is expressed as a percentage, representing the rate of change in price over the specified period.
Interpreting Rate-of-Change (ROC) Values:
The ROC indicator generates signals based on the comparison of its values to the zero line. Here’s how to interpret ROC values:
- Bullish Signal:
- If the value of ‘Rate-of-Change Value’ is greater than 0, it indicates a bullish signal.
- This signifies positive momentum, suggesting that the current price is higher than it was “n” periods ago.
- Bearish Signal:
- Conversely, if the value of ‘Rate-of-Change Value’ is less than 0, it signals a bearish scenario.
- This implies negative momentum, indicating that the current price is lower than it was “n” periods ago.
- Neutral Signal:
- If neither of the above conditions is met, the corresponding value in ‘ROC Interpret’ is assigned as ‘Neutral.’
- This suggests a lack of clear momentum in either direction.
Key Considerations for Trading with ROC:
To maximize the effectiveness of the ROC indicator in trading, consider the following key considerations:
- Divergence and Convergence: Watch for divergence or convergence between price movements and ROC. Divergence can signal potential reversals, while convergence may confirm the strength of a trend.
- Adjustment of Periods: Experiment with different periods for ROC to align with your trading strategy. Shorter periods provide more responsive signals but may generate more noise, while longer periods offer smoother trends.
- Confirmation with Other Indicators: Combine ROC signals with other technical indicators, such as moving averages or trendlines, to enhance the robustness of your trading strategy.
- Market Conditions: Be mindful of prevailing market conditions, as ROC may perform differently in trending markets compared to ranging markets. Adapt your approach based on the overall market environment.
- Risk Management: Implement sound risk management practices, including setting stop-loss orders and managing position sizes, to mitigate potential losses in volatile market conditions.
Conclusion:
The Rate-of-Change (ROC) indicator, with its focus on momentum, is a valuable asset for traders seeking to gauge the strength of price trends. By interpreting ROC signals and incorporating them into a comprehensive trading strategy, traders can make more informed decisions and navigate the complexities of the financial markets.
xCalData is an exceptional app available for Android devices that offers unbiased insights into stocks, allowing investors to make informed decisions. With its user-friendly interface and comprehensive features, xCalData provides a valuable resource for anyone interested in the stock market. Download the app from google play.
For Actionable Intelligence, subscribe to xCalData app on Android devices: https://tinyurl.com/downloadxCalData
Popular Posts
-
Stock of Interest . August 23, 2024
#HSCL (NSE) Stock Report | 23 Aug 2024
-
Stock of Interest . August 23, 2024
Add Zerodha trading account to xCalData
-
Stock of Interest . August 23, 2024
What is xCalData , how to use it and how accurate is it?
-
Stock of Interest . August 23, 2024
Jurik Moving Average (JMA): A Profit Trading Insight