Technical Indicator
Posted On: December 11, 2025
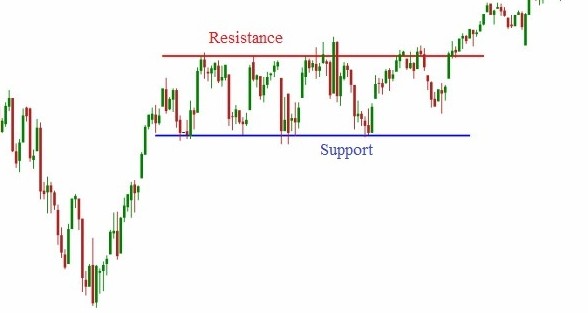
Mastering Support and Resistance: The Foundation of Technical Analysis
Uses of Support and Resistance
Identifying Entry and Exit Points
Traders buy near support and sell near resistance to maximize reward-to-risk ratios.
Spotting Trend Reversals
Price reactions at major levels help detect whether a trend may reverse or continue.
Setting Stop-Loss and Targets
Support and resistance zones provide logical areas to place stop-loss orders and profit targets.
Understanding Market Psychology
They reveal how buyers and sellers behave at key price levels, improving trading discipline.
How to Identify Support and Resistance:
Previous Highs and Lows
Look for repeated price reactions; old turning points often act as strong levels.
Horizontal Level
Mark areas where price paused, reversed, or consolidated in the past.
Trendlines
An upward trendline acts as dynamic support, while a downward trendline becomes dynamic resistance.
Moving Averages
Common MAs like 50-day, 100-day, and 200-day serve as support in uptrends and resistance in downtrends.
Conclusion
Support and resistance are essential building blocks of technical trading. They help traders identify high-probability opportunities, manage risk effectively, and understand price behaviour with greater clarity. When combined with trendlines, candlestick patterns, or indicators, these levels become even more reliable. Mastering support and resistance is a crucial step toward becoming a more confident and disciplined trader.
Where can I see further insights on this stock?
xCalData offers unbiased insights into stocks. Download the app from google play. For Actionable Intelligence, subscribe to xCalData app on Android devices: Download here
For Actionable Intelligence, subscribe to xCalData app on Android devices: https://tinyurl.com/downloadxCalData

Popular Posts
-
Stock of Interest . August 23, 2024
#HSCL (NSE) Stock Report | 23 Aug 2024
-
Stock of Interest . August 23, 2024
Add Zerodha trading account to xCalData
-
Stock of Interest . August 23, 2024
What is xCalData , how to use it and how accurate is it?
-
Stock of Interest . August 23, 2024
Jurik Moving Average (JMA): A Profit Trading Insight