Technical Indicator
Posted On: January 31, 2024
Mastering the Correlation Trend Indicator for Market Success
Unveiling the Correlation Trend Indicator (CTI)
In the ever-evolving landscape of financial markets, traders and analysts are continually in search of innovative tools to decipher trends and make informed decisions. One such groundbreaking addition to the trader’s toolkit is the Correlation Trend Indicator (CTI), a creation of the seasoned analyst John Ehler in 2020.
Understanding the CTI
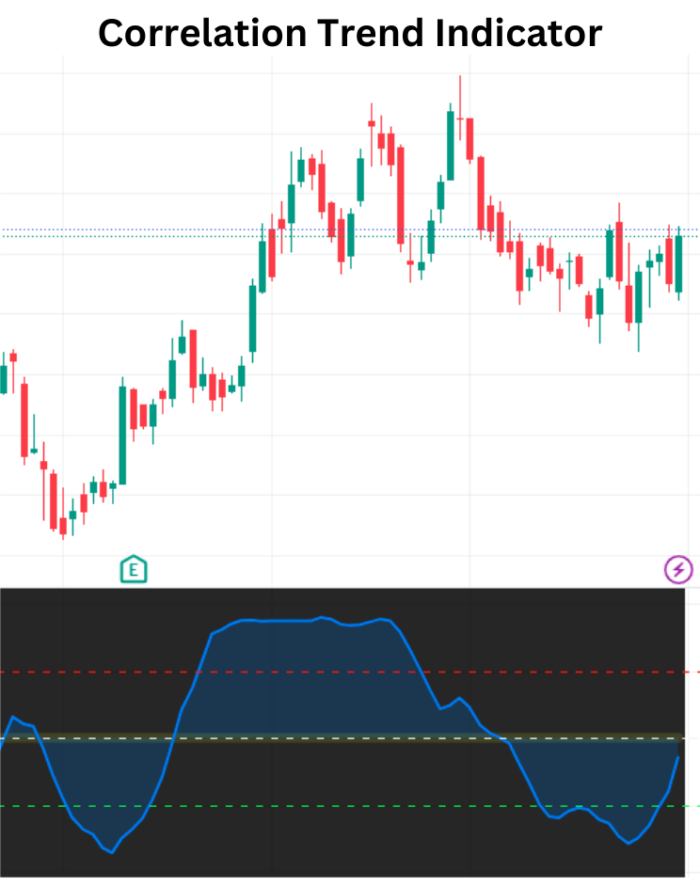
The Correlation Trend Indicator operates as an oscillator, furnishing values that span the spectrum from -1 to 1. At its core, this technical indicator gauges the Spearman correlation of the price with an ideal trend line—a straight line boasting an increasing slope.
Mathematical formula:
The formula for CTI (Correlation Trend Indicator) can be expressed as:
CTI = (Sx * Sy – n * Sxy) / sqrt ((Sx * Sx – n * Sxx) * (Sy * Sy – n * Syy))
Where,
Sx: Sum of x-values
Sy: Sum of y-values
Sxy: Sum of the product of x and y values
Sxx: Sum of the squared x-values
Syy: Sum of the squared y-values
n: Number of data points(periods)[Default: 20]
Decoding CTI Values
To leverage the power of the Correlation Trend Indicator effectively, it’s crucial to grasp the interpretation of its values and how they translate into actionable insights:
- Strong Bullish (0.5 to 1): When the ‘CTI Value’ resides in this range, the ‘CTI Interpret’ signals a robust bullish trend. This signifies a strong positive correlation with the ideal upward-sloping trend line.
- Bullish (0 to 0.5): If the ‘CTI Value’ surpasses 0 but is less than 0.5, the ‘CTI Interpret’ designates a bullish trend. While not as intense as the strong bullish signal, it still indicates a positive correlation with the upward trend.
- Bearish (-0.5 to 0): A ‘CTI Value’ less than 0 but greater than or equal to -0.5 results in a ‘CTI Interpret’ of bearish. This suggests a negative correlation with the ideal trend line but not as pronounced as a strong bearish signal.
- Strong Bearish (-1 to -0.5): When the ‘CTI Value’ falls below -0.5 and equals or exceeds -1, the ‘CTI Interpret’ screams strong bearish. This marks a robust negative correlation with the ideal upward-sloping trend.
- Neutral (Outside Defined Ranges): If the ‘CTI Value’ eludes the aforementioned ranges, the ‘CTI Interpret’ settles on neutral. This could signify a lack of strong correlation with the ideal trend line.
Integrating CTI into Trading Strategies
- Identifying Trend Strength: Correlation Trend Indicator offers a nuanced view of trend strength, allowing traders to gauge the intensity of bullish or bearish sentiment.
- Fine-Tuning Entry and Exit Points: Utilizing CTI interpretations, traders can fine-tune their entry and exit points based on the prevailing trend conditions.
- Risk Management: Understanding the strength of correlation aids in effective risk management, enabling traders to adjust positions in line with the perceived trend strength.
Conclusion
As traders navigate the complexities of financial markets, the Correlation Trend Indicator emerges as a valuable ally. Its ability to quantify the correlation with an ideal trend line provides a unique perspective on market trends. However, like any tool, it is essential to complement CTI with a holistic trading strategy and risk management principles for consistent success in dynamic markets.
xCalData is an exceptional app available for Android devices that offers unbiased insights into stocks, allowing investors to make informed decisions. With its user-friendly interface and comprehensive features, xCalData provides a valuable resource for anyone interested in the stock market. Download the app from google play.
For Actionable Intelligence, subscribe to xCalData app on Android devices: https://tinyurl.com/downloadxCalData
Popular Posts
-
Stock of Interest . August 23, 2024
#HSCL (NSE) Stock Report | 23 Aug 2024
-
Stock of Interest . August 23, 2024
Add Zerodha trading account to xCalData
-
Stock of Interest . August 23, 2024
What is xCalData , how to use it and how accurate is it?
-
Stock of Interest . August 23, 2024
Jurik Moving Average (JMA): A Profit Trading Insight