Technical Indicator
Posted On: February 8, 2024
Mastering Trend Strength with Relative Vigor Index (RVGI)
Introduction:
The Relative Vigor Index (RVGI) emerges as a powerful momentum technical indicator in the realm of technical analysis. By evaluating the strength of a trend through the interplay of a security’s closing price and its trading range, the Relative Vigor Index provides traders with valuable insights into potential trend reversals and continuations. This comprehensive guide delves into the intricacies of the RVGI, elucidating its calculation, interpretation, and practical applications in making informed trading decisions by using xCaldata App.
Understanding the Relative Vigor Index (RVGI):
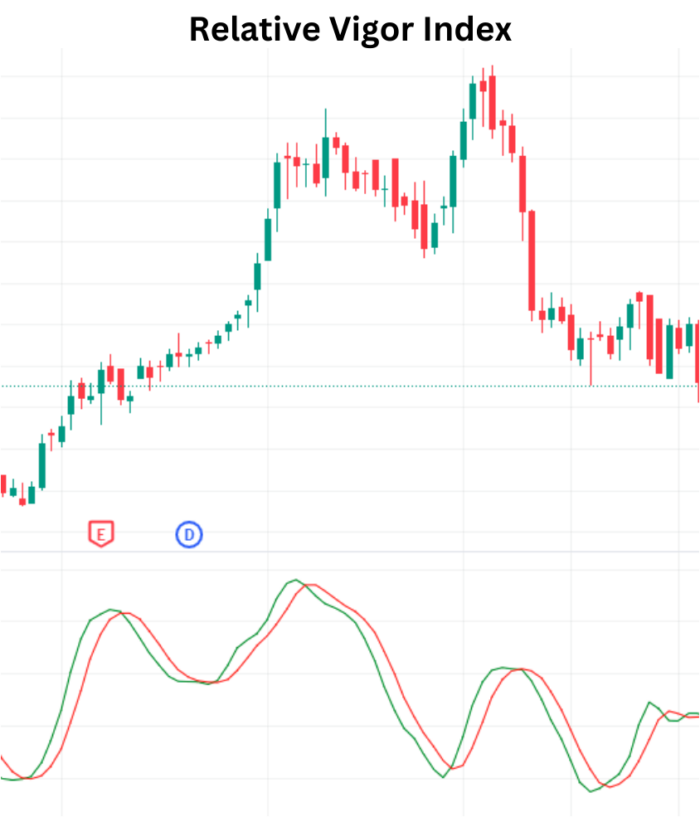
The Relative Vigor Index is a momentum indicator designed to gauge the strength of a trend by comparing a security’s closing price to its trading range. By employing a simple moving average (SMA) to smooth the results, the RVGI offers a more refined assessment of trend strength. Traders can leverage this indicator to identify potential trend reversals or affirmations, providing a nuanced perspective on market dynamics.
Calculation of RVGI:
The Relative Vigor Index is calculated by contrasting the current closing price with the previous closing price and comparing it to the current trading range. The application of a simple moving average further refines the results, offering a smoothed representation of trend strength.
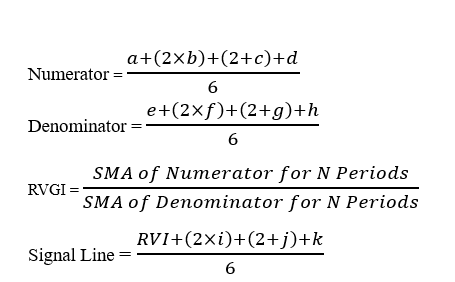
where:
a=Close−Open (diff1)
b=Close−Open One Bar Prior to a (diff1)
c=Close−Open One Bar Prior to b (diff1)
d=Close−Open One Bar Prior to c (diff1)
e=High−Low of Bar a (diff1)
f=High−Low of Bar b (diff1)
g=High−Low of Bar c (diff1)
h=High−Low of Bar d (diff1)
i=RVI Value One Bar Prior (rvgi_shift1)
j=RVI Value One Bar Prior to I (rvgi_shift1)
k=RVI Value One Bar Prior to j (rvgi_shift1)
N=Minutes/Hours/Days/Weeks/Months (RVGI_WINDOW)
SMA – Simple Moving Average
Interpreting RVGI Signals:
- Bearish Signal:
- Condition: Current RVGI < Current RVGI_Signal AND Previous RVGI ≥ Previous RVGI_Signal
- Interpretation: Indicates a bearish signal, suggesting a potential weakening or reversal of the current trend.
- Bearish Crossover: If signal line cross the RVGI line
- Bullish Signal:
- Condition: Current RVGI > Current RVGI_Signal AND Previous RVGI ≤ Previous RVGI_Signal
- Interpretation: Signifies a bullish signal, indicating a potential strengthening or continuation of the prevailing trend.
- Bullish Crossover: If RVGI line cross its Signal Line
- Neutral Signal:
- Condition: None of the above conditions met
- Interpretation: Implies a neutral signal, prompting traders to exercise caution and await clearer indications before making trading decisions.
Practical Applications of RVGI Indicator:
- Trend Reversal Identification:
- Utilize bearish RVGI signals to identify potential trend reversals and consider adjusting trading strategies accordingly.
- Trend Confirmation:
- Leverage bullish RVGI signals to affirm the strength of the existing trend and consider holding or adding to positions.
- Divergence Analysis:
- Explore divergence between price movements and RVGI signals for early indications of trend shifts.
- Swing Trading:
- Apply RVGI signals to assess the suitability of entering or exiting swing trades.
- Risk Management:
- Integrate RVGI signals into risk management strategies to enhance capital protection.
Conclusion:
The Relative Vigor Index (RVGI) stands as a valuable tool for traders seeking to assess and interpret trend strength with precision. By combining closing price differentials and trading range comparisons, the RVGI provides nuanced signals that empower traders to make well-informed decisions. As with any technical indicator, traders are encouraged to complement Relative Vigor Index signals with comprehensive market analysis and adopt prudent risk management practices. The Relative Vigor Index capability to identify potential trend reversals and affirm existing trends makes it a versatile asset for traders across various styles and preferences.
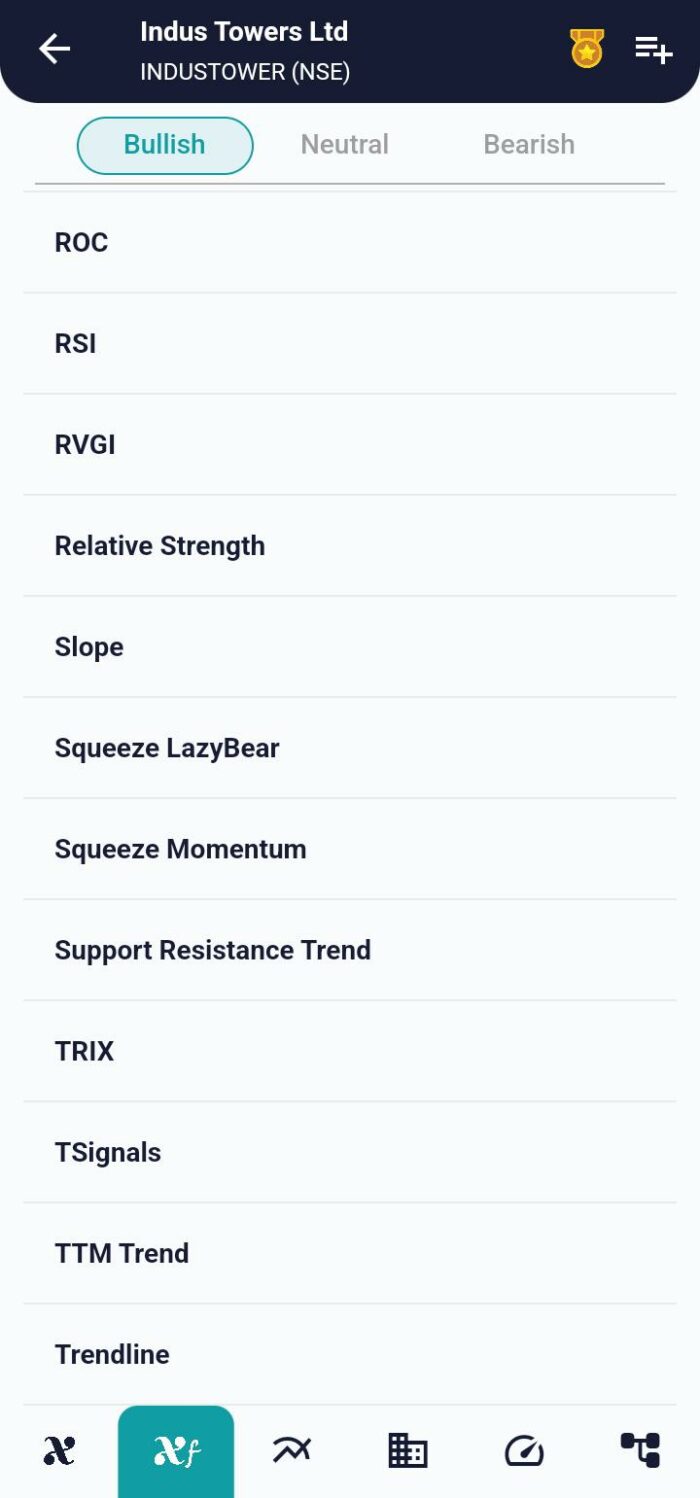
xCalData is an exceptional app available for Android devices that offers unbiased insights into stocks, allowing investors to make informed decisions. With its user-friendly interface and comprehensive features, xCalData provides a valuable resource for anyone interested in the stock market. Download the app from google play.
For Actionable Intelligence, subscribe to xCalData app on Android devices: https://tinyurl.com/downloadxCalData
Popular Posts
-
Stock of Interest . August 23, 2024
#HSCL (NSE) Stock Report | 23 Aug 2024
-
Stock of Interest . August 23, 2024
Add Zerodha trading account to xCalData
-
Stock of Interest . August 23, 2024
What is xCalData , how to use it and how accurate is it?
-
Stock of Interest . August 23, 2024
Jurik Moving Average (JMA): A Profit Trading Insight