Technical Indicator
Posted On: February 9, 2024
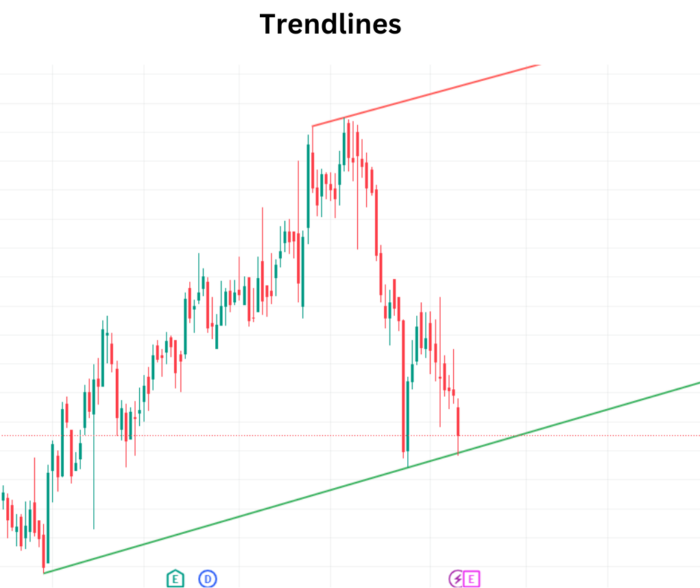
Mastering Trendlines: Basic for Traders
Trendlines Unveiled:
Trendlines stand as quintessential technical indicator for traders, providing a visual representation of price trends and aiding in the identification of potential directional movements. This comprehensive guide delves into the intricacies of trendlines, offering insights into their significance, application, and the art of drawing them effectively for informed decision-making.
Understanding Trendlines:
- Visualizing Price Trends:
- Trendlines are lines drawn on charts, connecting a series of prices, whether highs or lows.
- They serve as visual representations of the prevailing direction of price movements.
- Support and Resistance:
- Trendlines act as dynamic support or resistance levels, offering insights into potential price reversals or continuations.
- Connecting pivot highs or lows creates trendlines that showcase the path of least resistance.
Key Takeaways for Traders:
- Direction and Speed:
- Trendlines provide a clear depiction of the direction and speed of price movements.
- By observing the slope and angle of a trendline, traders can gauge the momentum and strength of a trend.
- Pattern Recognition:
- During periods of price contraction, trendlines help identify patterns, aiding in the recognition of chart formations.
- Patterns within trendlines contribute to a comprehensive understanding of market dynamics.
Creating Effective Trendlines:
- Minimum Two Points:
- To create a trendline, a minimum of two points on a price chart is required.
- Analysts may choose different time frames, intervals, or tick intervals based on individual preferences.
- Versatility Across Time Frames:
- Trendlines are versatile, applicable across various time frames, from one minute to daily or weekly charts.
- The adaptability of trendlines allows traders to identify trends regardless of the chosen time period.
Interpreting Trendlines:
- Trend is Your Friend:
- Technical analysts believe in the mantra, “the trend is your friend,” highlighting the importance of identifying and aligning with prevailing trends.
- Directional Clarity:
- Trendlines offer directional clarity, guiding traders in making informed decisions based on the observed trend.
Practical Application:
- Support and Resistance Validation:
- Traders use trendlines to validate potential support or resistance levels.
- Breakouts or bounces at trendlines contribute to strategic entry and exit points.
- Pattern-Based Strategies:
- Patterns within trendlines, such as channels or trend reversals, form the basis for pattern-based trading strategies.
Conclusion:
Mastering trendlines is an essential skill for traders seeking to navigate dynamic market conditions. Whether identifying trends, validating support and resistance, or recognizing chart patterns, trendlines serve as invaluable tools in the trader’s arsenal. Traders are encouraged to experiment with different time frames and intervals, refining their ability to draw effective trendlines that align with their trading strategies. As trends unfold, trendlines provide a roadmap for strategic decision-making, empowering traders to ride the waves of market dynamics with confidence and precision.
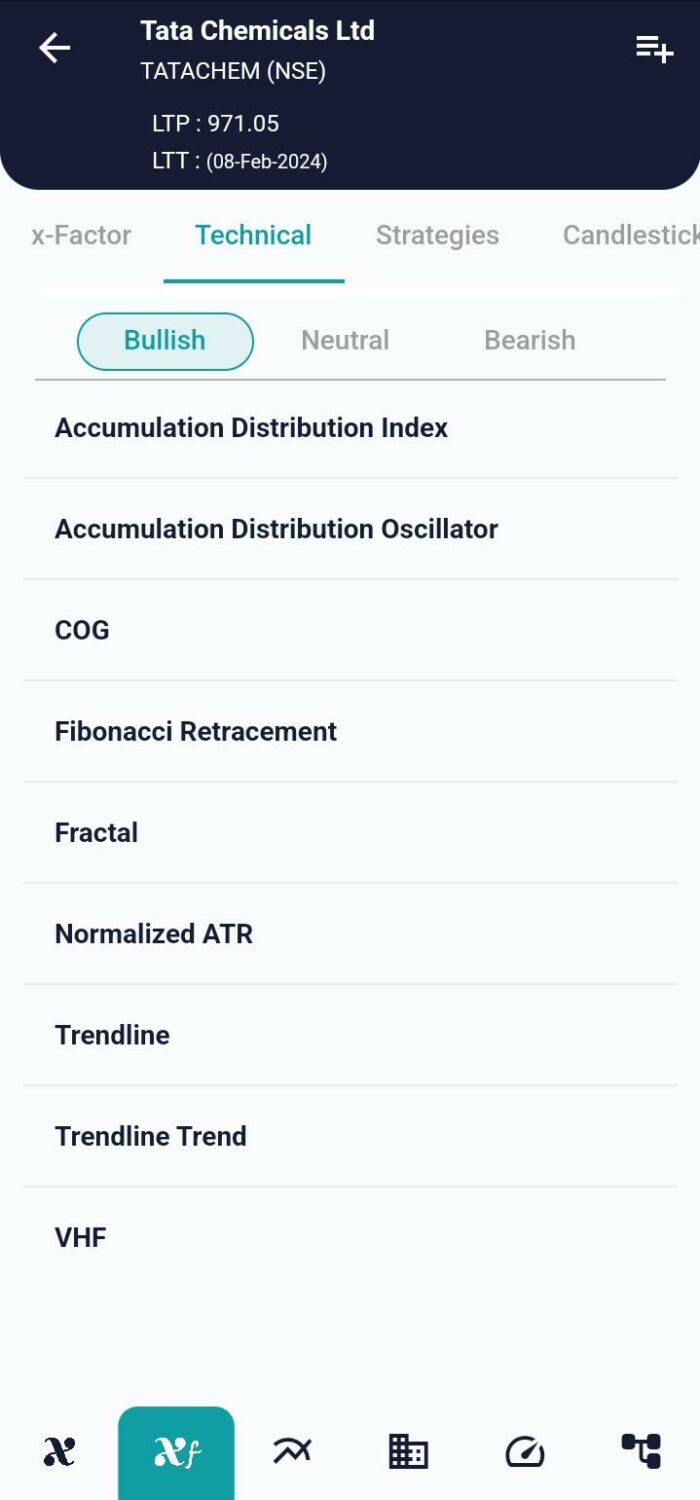
xCalData is an exceptional app available for Android devices that offers unbiased insights into stocks, allowing investors to make informed decisions. With its user-friendly interface and comprehensive features, xCalData provides a valuable resource for anyone interested in the stock market. Download the app from google play.
For Actionable Intelligence, subscribe to xCalData app on Android devices: https://tinyurl.com/downloadxCalData
Popular Posts
-
Stock of Interest . August 23, 2024
#HSCL (NSE) Stock Report | 23 Aug 2024
-
Stock of Interest . August 23, 2024
Add Zerodha trading account to xCalData
-
Stock of Interest . August 23, 2024
What is xCalData , how to use it and how accurate is it?
-
Stock of Interest . August 23, 2024
Jurik Moving Average (JMA): A Profit Trading Insight