Strategy
Posted On: January 25, 2024
Mastering Trends: Williams R – MACD Strategy
In the ever-evolving landscape of trading strategies, the amalgamation of Williams R and Moving Average Convergence Divergence (MACD) introduces a nuanced approach. This strategy strategically combines the insights derived from Williams R, which gauges overbought or oversold conditions, and MACD, a powerful trend-following momentum indicator. While showcasing promising accuracy, it’s paramount for traders to acknowledge the inherent risks and approach this strategy with calculated decision-making. This blog post aims to demystify the complexities of the Williams R – MACD Strategy, exploring its indicators, datasets, parameters, and the conditions triggering buy and sell signals.
Introduction to the Williams R – MACD Strategy
The Williams R – MACD Strategy leverages the strengths of two influential indicators – Williams R and MACD. Williams R helps identify potential overbought or oversold conditions, while MACD provides insights into the strength and direction of trends. This strategic fusion aims to capitalize on the unique insights provided by each indicator, offering traders a robust tool for decision-making.
Indicators Utilized in the Strategy
To execute the Williams R – MACD Strategy successfully, traders rely on two key indicators:
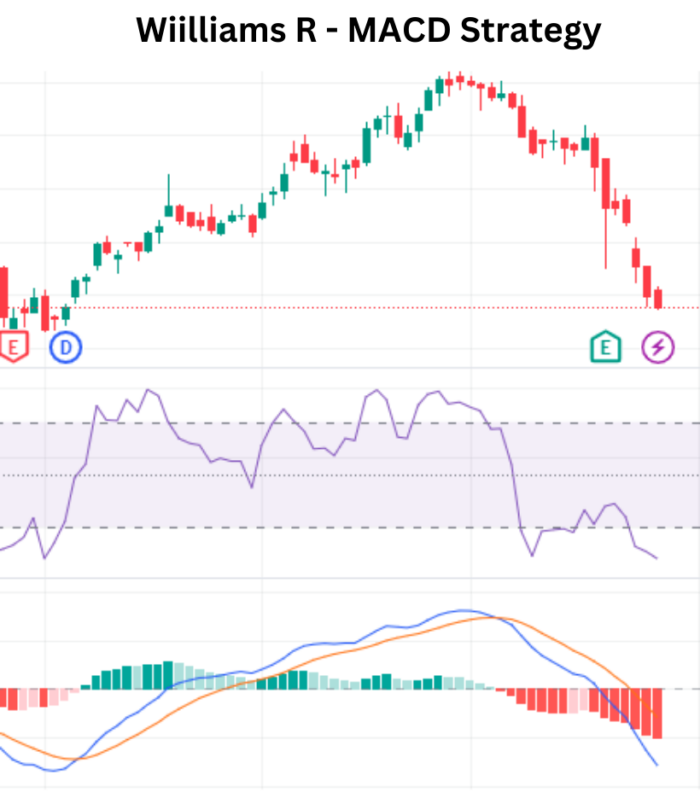
- Williams R: This oscillator measures overbought or oversold conditions on a scale from 0 to -100. Values above -20 indicate potential overbought conditions, while values below -80 suggest potential oversold conditions.
- Moving Average Convergence Divergence (MACD): MACD is a trend-following momentum indicator that shows the relationship between two moving averages of a security’s price. It consists of the MACD line, signal line, and histogram.
Datasets Utilized in the Strategy
Three vital datasets contribute to the strategy’s effectiveness:
- Technical Data: This dataset includes various technical indicators, prominently Williams R and MACD. Technical analysis forms the cornerstone of the strategy.
- Price Data: Essential for calculating indicators and identifying buy/sell signals, price data provides information on opening, closing, high, and low prices.
- Calendar Data: Timely market events and economic releases are crucial for understanding broader market dynamics and enhancing decision-making.
Key Parameters of the Strategy
The Williams R – MACD Strategy relies on specific parameters for effective implementation:
- Previous Technical Data: Access to the previous 2 days’ technical data for a single business day is crucial for analyzing trends and momentum.
- Williams R Value: This parameter involves the specific Williams R value, guiding buy/sell decisions. A value above -50 suggests potential bullish conditions.
- MACD Interpretation Value: The MACD value is integral to the strategy. A Buy signal occurs when MACD shows strength, and a Sell signal triggers when MACD suggests weakness.
Buy/Sell Conditions
Buy:
- Initiate a buy position when Williams R is above -50, indicating potential bullish conditions, and MACD exhibits a Buy signal, suggesting strength in the prevailing trend.
Sell:
- Execute a sell position when MACD signals a Sell, indicating potential weakness in the prevailing trend.
Conclusion: Navigating Trends with Precision
In conclusion, the Williams R – MACD Strategy equips traders with a powerful tool for navigating trends with precision. By combining the insights derived from Williams R and MACD, traders can make informed decisions. However, given the inherent risks, traders must exercise caution and adapt to evolving market conditions. As this strategy becomes an integral part of a trader’s toolkit, it enhances precision and opens doors to potential opportunities in the ever-evolving landscape of financial markets.
Popular Posts
-
Stock of Interest . August 23, 2024
#HSCL (NSE) Stock Report | 23 Aug 2024
-
Stock of Interest . August 23, 2024
Add Zerodha trading account to xCalData
-
Stock of Interest . August 23, 2024
What is xCalData , how to use it and how accurate is it?
-
Stock of Interest . August 23, 2024
Jurik Moving Average (JMA): A Profit Trading Insight