Technical Indicator
Posted On: February 9, 2024
Mastering Trends with TTM Trend (TTM_TREND)
Introduction:
Welcome to the realm of TTM Trend (TTM_TREND), an technical indicator inspired by John Carter’s wisdom in “Mastering the Trade.” This potent tool distinguishes itself by painting bars in vibrant green or red hues, offering traders a visual guide through the complex terrain of market trends. By scrutinizing the relationship between current prices and the average price of the preceding five bars, TTM_TREND emerges as a strategic ally in trade decisions.
Key Components of TTM Trend :
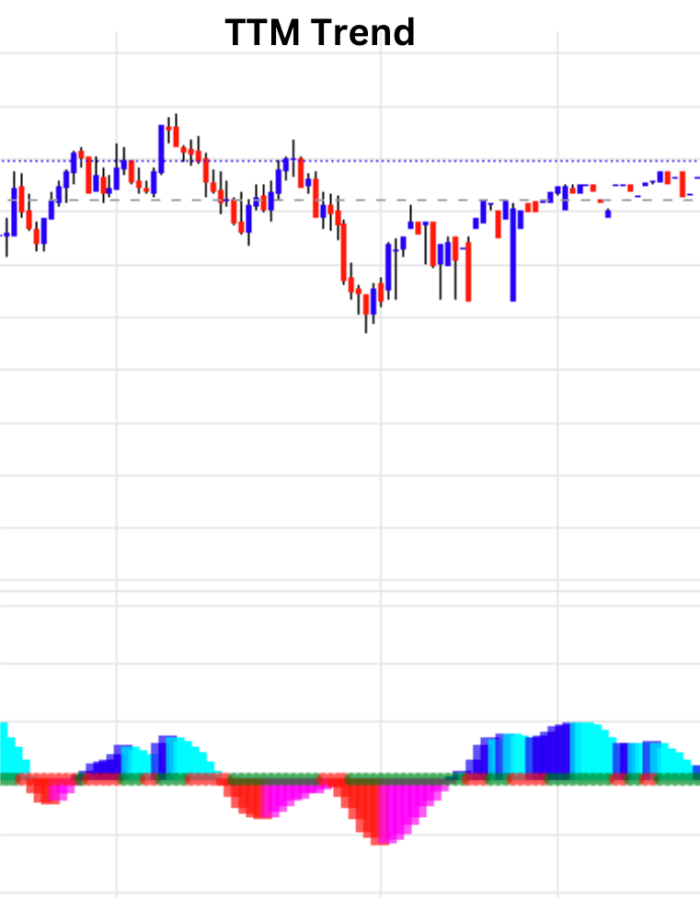
- TTM_TREND Value:
- TTM_TREND encapsulates the essence of trend identification, assigning values of 0 or 1 to denote prevailing market conditions.
- A green bar (1) signifies that the current price surpasses the average of the previous five bars, indicating an upward trend. Conversely, a red bar (0) denotes a price below the five-bar average, signaling a downward trend.
Signal Generation Criteria:
- Buy Signal:
- Initiated when the current day’s TTM Trend value is 1, and the previous day’s value is 0.
- This configuration serves as a compelling buy signal, indicating an opportune moment to enter a trade.
- Sell Signal:
- Illuminated when the current day’s TTM Trend value is 0, and the previous day’s value is 1.
- A sell signal prompts traders to consider exiting a position, aligning with the shift in trend dynamics.
- Hold Position:
- When TTM Trend values remain constant (0 or 1) across consecutive days, a hold position is recommended.
- The hold stance acknowledges a period of trend continuity, allowing traders to maintain their current position.
Strategic Implications:
- Visual Trend Identification:
- TTM_TREND’s visual representation simplifies trend identification, enabling traders to swiftly gauge market dynamics.
- Green and red bars act as an intuitive guide, offering a vivid portrayal of prevailing trends.
- Dynamic Trade Management:
- Traders can leverage TTM_TREND to dynamically manage trades based on color transitions.
- Two bars of the opposite color serve as pivotal signals for trade initiation or exit, aligning with shifts in trend sentiment.
Implementation Strategies:
- Trend-Centric Strategies:
- TTM_TREND seamlessly integrates into strategies centered around trend analysis.
- Buy and sell signals act as strategic waypoints, facilitating timely trade decisions in alignment with evolving trends.
- Contrarian Approach:
- Savvy traders may employ a contrarian approach, considering trades against prevailing trends based on TTM_TREND signals.
- Dynamic shifts in bar colors prompt contrarian traders to explore alternative trade scenarios.
Conclusion:
TTM Trend (TTM_TREND) emerges as a dynamic and visually intuitive indicator, offering traders valuable insights into market trends. By harnessing the power of color-coded bars, TTM_TREND provides a real-time canvas for traders to paint their strategies upon. The model’s simplicity belies its effectiveness, making it a versatile tool for traders navigating the complexities of trend analysis. Whether guiding entry and exit points or facilitating a nuanced understanding of evolving trends, TTM_TREND stands as a beacon of clarity in the ever-shifting landscape of financial markets.
xCalData is an exceptional app available for Android devices that offers unbiased insights into stocks, allowing investors to make informed decisions. With its user-friendly interface and comprehensive features, xCalData provides a valuable resource for anyone interested in the stock market. Download the app from google play.
For Actionable Intelligence, subscribe to xCalData app on Android devices: https://tinyurl.com/downloadxCalData

Popular Posts
-
Stock of Interest . August 23, 2024
#HSCL (NSE) Stock Report | 23 Aug 2024
-
Stock of Interest . August 23, 2024
Add Zerodha trading account to xCalData
-
Stock of Interest . August 23, 2024
What is xCalData , how to use it and how accurate is it?
-
Stock of Interest . August 23, 2024
Jurik Moving Average (JMA): A Profit Trading Insight