Strategy
Posted On: January 25, 2024
Mastering Volatility and Momentum: Bollinger Bands – RSI Strategy
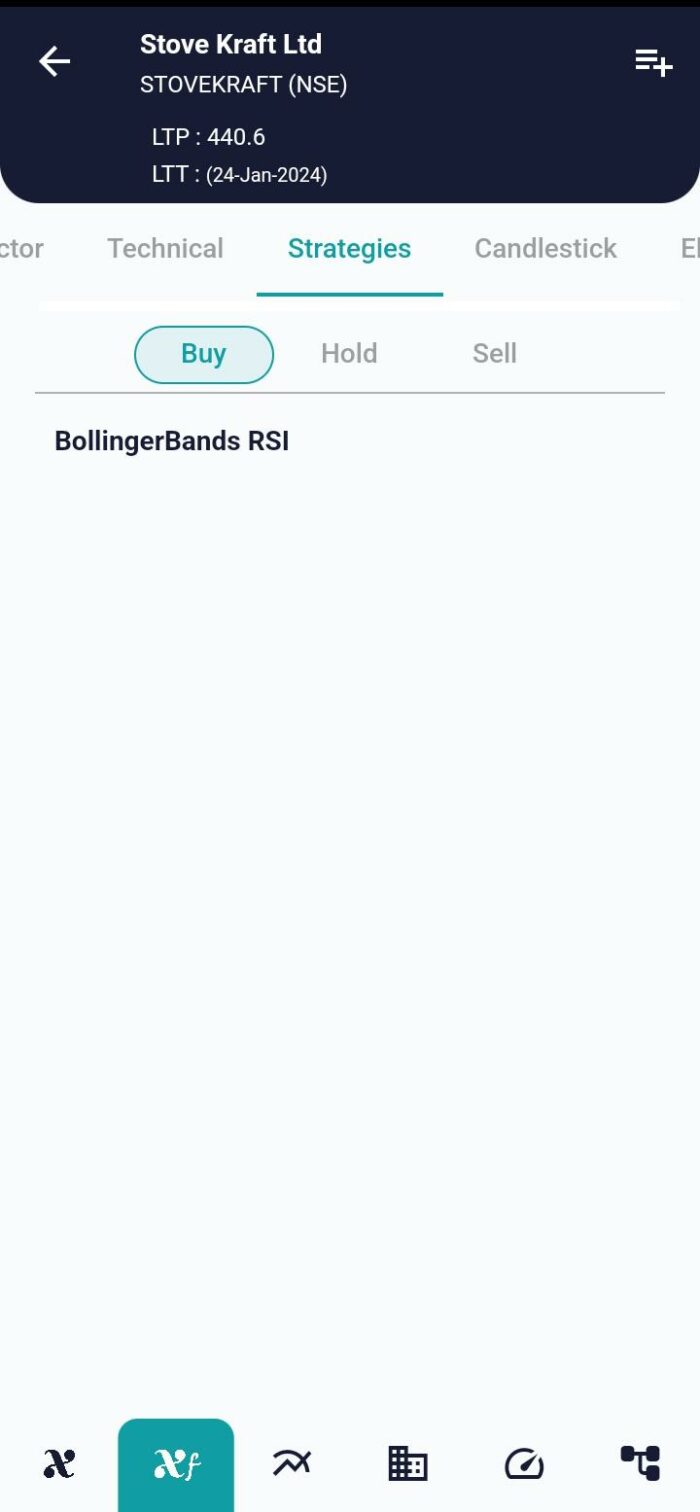
In the dynamic realm of trading strategies, the fusion of Bollinger Bands – RSI (Relative Strength Index) Strategy introduces a comprehensive approach. This strategy strategically combines the insights derived from Bollinger Bands, which gauge volatility, and RSI, which measures momentum. While showcasing promising accuracy, it’s paramount for traders to acknowledge the inherent risks and approach this strategy with calculated decision-making. This blog post aims to unravel the intricacies of the Bollinger Bands – RSI Strategy, exploring its indicators, datasets, parameters, and the conditions triggering buy and sell signals by using xCaldata App.
Introduction to the Bollinger Bands – RSI Strategy
The Bollinger Bands – RSI Strategy leverages the strengths of two influential indicators – Bollinger Bands and RSI. Bollinger Bands highlight market volatility, while RSI identifies momentum. This strategic fusion aims to capitalize on the unique insights provided by each indicator, offering traders a robust tool for decision-making.
Indicators Utilized in the Strategy
To execute the Bollinger Bands – RSI Strategy successfully, traders rely on two key indicators:
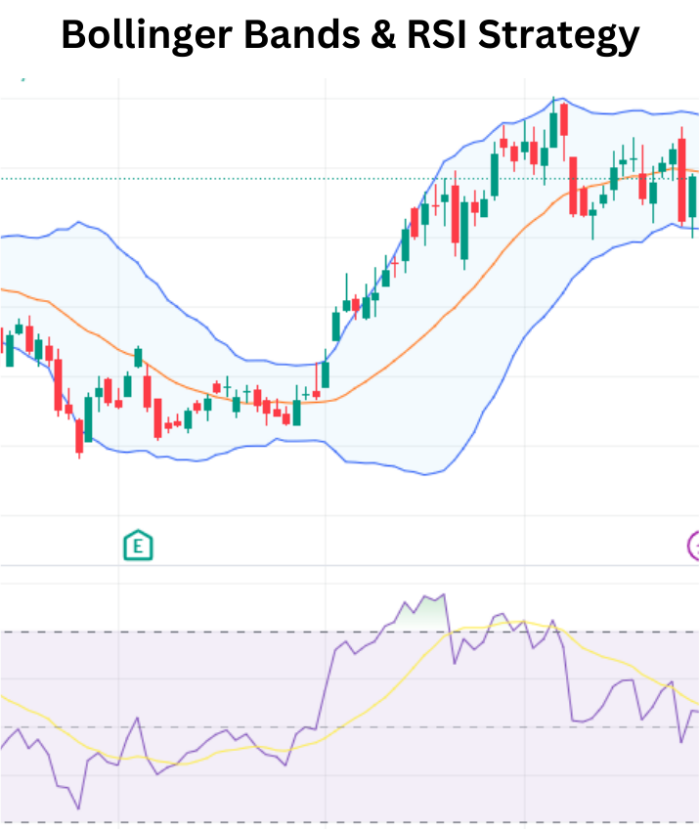
- Bollinger Bands: These bands consist of a middle band being an N-period simple moving average (SMA) and two outer bands calculated by adding and subtracting a specified standard deviation from the middle band. They highlight potential price reversal points.
- Relative Strength Index (RSI): RSI is a momentum oscillator that measures the speed and change of price movements. Values above 70 suggest overbought conditions, while values below 30 indicate oversold conditions.
Datasets Utilized in the Strategy
Three vital datasets contribute to the strategy’s effectiveness:
- Technical Data: This dataset includes various technical indicators, prominently Bollinger Bands and RSI. Technical analysis forms the cornerstone of the strategy.
- Price Data: Essential for calculating indicators and identifying buy/sell signals, price data provides information on opening, closing, high, and low prices.
- Calendar Data: Timely market events and economic releases are crucial for understanding broader market dynamics and enhancing decision-making.
Key Parameters of the Strategy
The Bollinger Bands – RSI Strategy relies on specific parameters for effective implementation:
- Previous Price Data: Access to the previous 22 days’ price data for a single business day is crucial for volatility and momentum analysis.
- RSI Value: This parameter involves the specific RSI value, guiding buy/sell decisions. A value below 35 suggests potential oversold conditions.
- Bollinger Bands (BB) Lower and Upper Values: These values indicate the lower and upper bands of the Bollinger Bands. Breakouts from these bands trigger potential buy and sell signals.
Buy/Sell Conditions
Buy:
- Initiate a buy position when the previous candle breaks the BB Lower band, RSI is below 35, and the current candle is inside the BB Lower. If RSI starts to rise, it generates a buy signal, suggesting potential momentum.
Sell:
- Execute a sell position when the previous candle breaks the BB Upper band, and the current candle is inside the BB Upper. This condition suggests potential overbought conditions and triggers a sell signal.
Conclusion: Mastering Market Dynamics
In conclusion, the Bollinger Bands – RSI Strategy equips traders with a powerful tool for navigating market volatility and momentum. By combining the insights derived from Bollinger Bands and RSI, traders can make informed decisions. However, given the inherent risks, traders must exercise caution and adapt to evolving market conditions. As this strategy becomes an integral part of a trader’s toolkit, it enhances precision and opens doors to potential opportunities in the ever-evolving landscape of financial markets.
xCalData is an exceptional app available for Android devices that offers unbiased insights into stocks, allowing investors to make informed decisions. With its user-friendly interface and comprehensive features, xCalData provides a valuable resource for anyone interested in the stock market. Download the app from google play.
For Actionable Intelligence, subscribe to xCalData app on Android devices: https://tinyurl.com/downloadxCalData
Popular Posts
-
Stock of Interest . August 23, 2024
#HSCL (NSE) Stock Report | 23 Aug 2024
-
Stock of Interest . August 23, 2024
Add Zerodha trading account to xCalData
-
Stock of Interest . August 23, 2024
What is xCalData , how to use it and how accurate is it?
-
Stock of Interest . August 23, 2024
Jurik Moving Average (JMA): A Profit Trading Insight