Technical Indicator
Posted On: February 8, 2024
Mastering Volatility with the Relative Volatility Index (RVI)
Introduction:
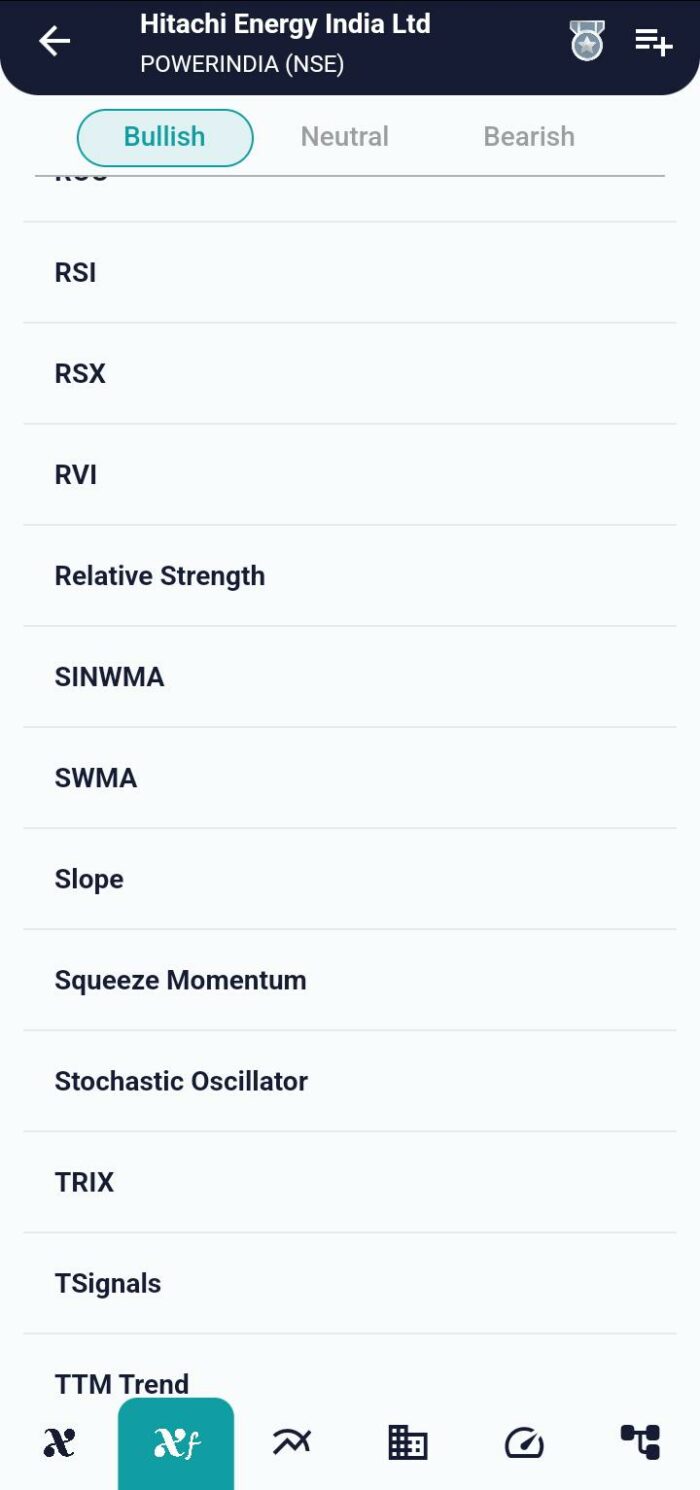
The Relative Volatility Index (RVI) emerges as a robust volatility technical indicator, offering traders valuable insights into market dynamics by measuring the standard deviation of prices over time. Distinct from the Relative Strength Index (RSI), the RVI provides a nuanced perspective on volatility, aiding traders in identifying potential buy and sell signals. This comprehensive guide delves into the intricacies of the RVI, elucidating its calculation, interpretation, and practical applications in navigating market volatility by using xCaldata App.
Understanding the Relative Volatility Index (RVI):
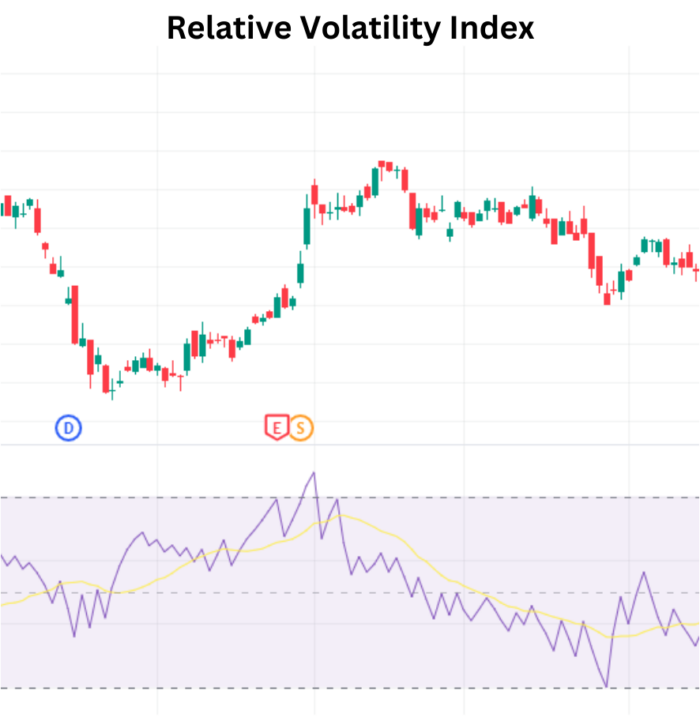
The Relative Volatility Index serves as a volatility indicator, akin to the RSI, but with a focus on measuring the standard deviation of prices as they change over time. By employing high and low price standard deviation, the RVI distinguishes itself from the RSI, which measures absolute price changes. Displayed on the chart with a range of 0 to 100, the Relative Volatility Index becomes a valuable tool for traders seeking to assess and interpret market volatility.
Calculation of RVI:
The calculation of Relative Volatility Index mirrors that of the RSI, but with a key distinction – it utilizes high and low price standard deviation. This nuanced approach enables the RVI to provide a more refined assessment of volatility.

Where:
Usum is the averaged sum of STD for positive days
Dsum is the averaged sum of STD for negative days
If close price is above the previous close, then u = STD (n); otherwise, u = 0
If close is below the previous close, then d = STD (n); otherwise, d = 0
where n is bar period selected by a user
U sum = sum (u)/n
D sum = sum (d)/n
Interpreting Relative Volatility Index Signals:
- Volatility to the Upside (Potential Buy Signal):
- Condition: RVI value is above 50
- Interpretation: Confirms volatility to the upside, suggesting a potential buy signal. Traders may consider opportunities to enter or strengthen long positions.
- Volatility to the Downside (Potential Sell Signal):
- Condition: RVI value is below 50
- Interpretation: Indicates volatility to the downside, confirming a potential sell signal. Traders may evaluate opportunities to enter or reinforce short positions.
Practical Applications of RVI Indicator:
- Buy and Sell Signal Confirmation:
- Use RVI signals to confirm potential buy or sell signals derived from other technical indicators or trading strategies.
- Trend Confirmation:
- Integrate RVI analysis to affirm the strength of prevailing trends, aiding traders in trend-following strategies.
- Volatility Assessment:
- Gauge market volatility using RVI values, assisting traders in adjusting risk management strategies accordingly.
- Divergence Analysis:
- Explore divergences between price movements and RVI signals for early indications of potential trend shifts.
- Swing Trading:
- Apply RVI signals to assess the suitability of entering or exiting swing trades based on changing volatility.
- Risk Management:
- Incorporate RVI insights into risk management protocols to optimize position sizing and protect capital.
Conclusion:
The Relative Volatility Index (RVI) stands as a valuable ally for traders navigating the complexities of market volatility. By focusing on standard deviation of prices, the Relative Volatility Index provides nuanced signals that empower traders to make informed decisions regarding potential buy or sell opportunities. As with any technical indicator, prudent traders are encouraged to complement RVI signals with comprehensive market analysis and risk management strategies. The RVI’s ability to assess volatility and confirm trend signals renders it a versatile tool suitable for traders across diverse trading styles.
xCalData is an exceptional app available for Android devices that offers unbiased insights into stocks, allowing investors to make informed decisions. With its user-friendly interface and comprehensive features, xCalData provides a valuable resource for anyone interested in the stock market. Download the app from google play.
For Actionable Intelligence, subscribe to xCalData app on Android devices: https://tinyurl.com/downloadxCalData
Popular Posts
-
Stock of Interest . August 23, 2024
#HSCL (NSE) Stock Report | 23 Aug 2024
-
Stock of Interest . August 23, 2024
Add Zerodha trading account to xCalData
-
Stock of Interest . August 23, 2024
What is xCalData , how to use it and how accurate is it?
-
Stock of Interest . August 23, 2024
Jurik Moving Average (JMA): A Profit Trading Insight