Technical Indicator
Posted On: February 9, 2024
Navigating Market Risks with Ulcer Index (UI)
Introduction:
Dive into the intricate world of market risk assessment with the Ulcer Index (UI), a technical analysis technical indicator crafted by the minds of Peter Martin and Byron McCann. Originating in 1987, the UI offers a unique perspective on downward volatility, providing traders with a valuable measure of drawdown or retracement over a specified period. In the pursuit of optimizing risk management, the UI becomes a guiding light for strategic decision-making.
Key Components:
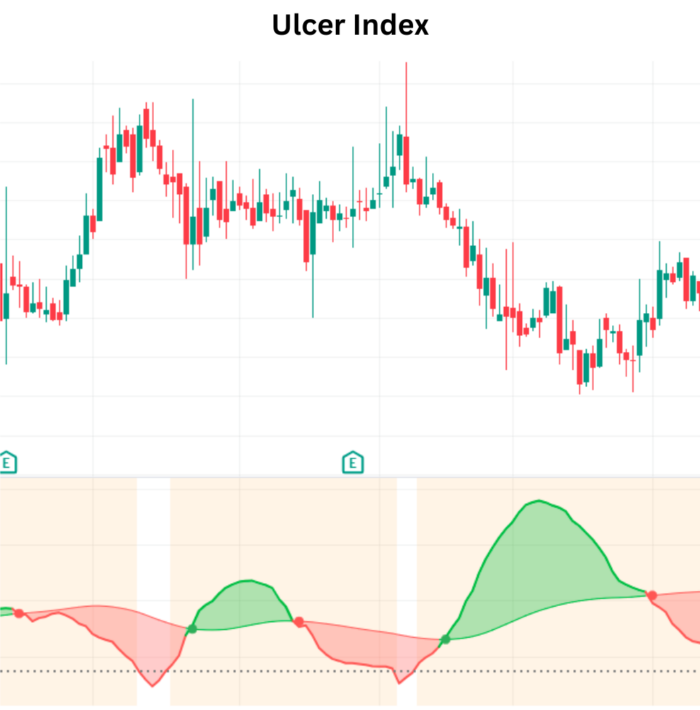
- Ulcer Index (UI):
- The Ulcer Index quantifies the extent of downwards volatility, offering a numerical representation of drawdown or retracement within a defined timeframe.
- As a crucial risk measure, UI equips traders with insights into market fluctuations, aiding in the identification of periods characterized by heightened risk.
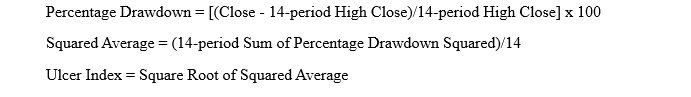
Formula for UI
Signal Generation Criteria:
- Sell Signal:
- Triggered when the previous day’s Ulcer Index value is less than the cutoff value of 5, and the present-day Ulcer Index value surpasses this threshold.
- This configuration prompts a sell signal, signaling a potential increase in downwards volatility and advising traders to exercise caution.
- Buy Signal:
- Activated when the previous day’s Ulcer Index value is greater than the cutoff value of 5, but the present-day Ulcer Index value falls below this critical threshold.
- A buy signal emerges, indicating a potential alleviation of downwards volatility and presenting an opportunity for traders to consider entry into the market…
Strategic Implications:
- Volatility-Driven Risk Management:
- UI serves as a valuable tool for traders focused on effective risk management.
- Sell signals based on UI provide insights into periods of increased risk, empowering traders to adjust their strategies accordingly.
- Contrarian Approach:
- Savvy traders may leverage UI signals to adopt a contrarian approach, considering trades that align with potential shifts in market dynamics.
- UI’s ability to identify changing volatility levels aids contrarian traders in exploring counter-trend opportunities.
Implementation Strategies:
- Risk-Adjusted Decision-Making:
- UI becomes an integral part of decision-making processes, especially in scenarios where risk assessment is paramount.
- Traders can dynamically adjust their positions based on UI signals, optimizing risk-reward ratios.
- Market Timing:
- UI signals contribute to effective market timing strategies, allowing traders to enter or exit positions with heightened awareness of prevailing volatility.
- Strategic alignment with UI signals enhances the precision of market entry and exit points.
Conclusion:
The Ulcer Index (UI) emerges as a potent instrument for traders navigating the complexities of market risk. Its nuanced evaluation of downwards volatility provides a nuanced understanding of drawdown or retracement, empowering traders to make informed decisions. The model’s simplicity, coupled with its profound impact on risk management, positions UI as a valuable asset in the trader’s toolkit. Whether signaling potential risk escalation or identifying windows of opportunity, UI stands as a reliable guide in the ever-evolving landscape of financial markets.
xCalData is an exceptional app available for Android devices that offers unbiased insights into stocks, allowing investors to make informed decisions. With its user-friendly interface and comprehensive features, xCalData provides a valuable resource for anyone interested in the stock market. Download the app from google play.
For Actionable Intelligence, subscribe to xCalData app on Android devices: https://tinyurl.com/downloadxCalData
Popular Posts
-
Stock of Interest . August 23, 2024
#HSCL (NSE) Stock Report | 23 Aug 2024
-
Stock of Interest . August 23, 2024
Add Zerodha trading account to xCalData
-
Stock of Interest . August 23, 2024
What is xCalData , how to use it and how accurate is it?
-
Stock of Interest . August 23, 2024
Jurik Moving Average (JMA): A Profit Trading Insight