Technical Indicator
Posted On: January 31, 2024
Navigating Market Shifts with the Coppock Curve: A Deep Dive
Understanding the Coppock Curve
The Coppock Curve, also known as the “Coppock Guide,” stands as a pivotal long-term price momentum technical indicator utilized to identify significant downturns and upturns in stock market indices. Introduced by Edwin Coppock in 1962, this technical tool has proven its mettle in providing buy and sell signals for major stock indexes and related ETFs.
Calculation of the Coppock Curve
This indicator is derived from a meticulous calculation involving a 10-month weighted moving average (WMA) of the sum of the 14-month rate of change (ROC) and the 11-month ROC for the index in question. Here’s the breakdown of the calculation:
Coppock Curve=WMA10(ROC14+ROC11)
- Weighted Moving Average (WMA): A 10-period WMA is applied to the sum of the 14-period ROC and the 11-period ROC.
- Rate of Change (ROC): ROC is calculated for both 14 and 11 periods based on the monthly closing prices.
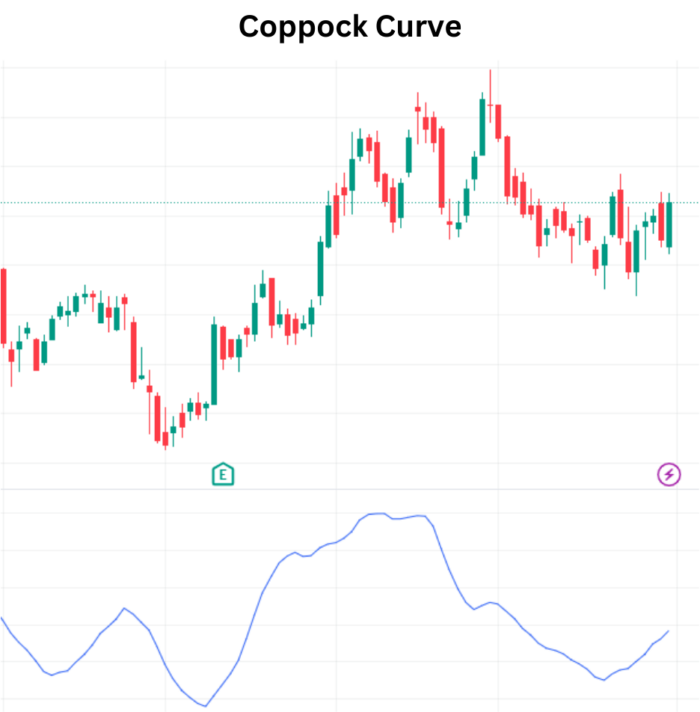
Interpreting the Coppock Curve
The Coppock Curve is strategically designed for application on a monthly candlestick chart, where each candle represents one month. Interpretation is straightforward:
- Buy Signal:
The curve rising above zero indicates a buy signal. - Sell Signal:
Conversely, a drop below zero signals a sell indication. - Hold Signal:
The curve hovering above zero implies holding onto existing investments.
Application Example
To exemplify, let’s apply the Coppock Curve to the SPDR S&P 500 ETF (SPY). The general strategy involves buying when the curve surpasses the zero line and considering selling when it dips below zero. Holding onto the investment is recommended when the curve is above zero.
In historical instances, the Coppock Curve kept investors out of substantial portions of the 2001 and 2008 market declines. However, it is essential to note that false signals and the inherent lag in identifying major market shifts pose limitations.
Distinguishing Coppock Curve from RSI
While both the Coppock Curve and the Relative Strength Index (RSI) provide insights into market dynamics, they differ in their calculations and trade signal generation. The ROC used in the Coppock Curve varies from the RSI, leading to disparate signals.
Limitations and Considerations
- False Signals: Quick movements above and below the zero line may generate false signals, prompting unwarranted trades.
- Curve Fitting: Traders often adjust default settings, introducing curve fitting biases that might not translate into reliable future signals.
- Lag in Identifying Peaks and Troughs: The reliance on 10-, 11-, and 14-month averages contributes to a lag in pinpointing major market tops and bottoms.
In essence, the Coppock Curve, with its historical significance, remains a valuable tool for long-term investors. However, a judicious approach considering its limitations, coupled with complementary analytical tools, ensures a more robust strategy in navigating the complexities of the market.
xCalData is an exceptional app available for Android devices that offers unbiased insights into stocks, allowing investors to make informed decisions. With its user-friendly interface and comprehensive features, xCalData provides a valuable resource for anyone interested in the stock market. Download the app from google play.
For Actionable Intelligence, subscribe to xCalData app on Android devices: https://tinyurl.com/downloadxCalData
Popular Posts
-
Stock of Interest . August 23, 2024
#HSCL (NSE) Stock Report | 23 Aug 2024
-
Stock of Interest . August 23, 2024
Add Zerodha trading account to xCalData
-
Stock of Interest . August 23, 2024
What is xCalData , how to use it and how accurate is it?
-
Stock of Interest . August 23, 2024
Jurik Moving Average (JMA): A Profit Trading Insight