Technical Indicator
Posted On: February 6, 2024
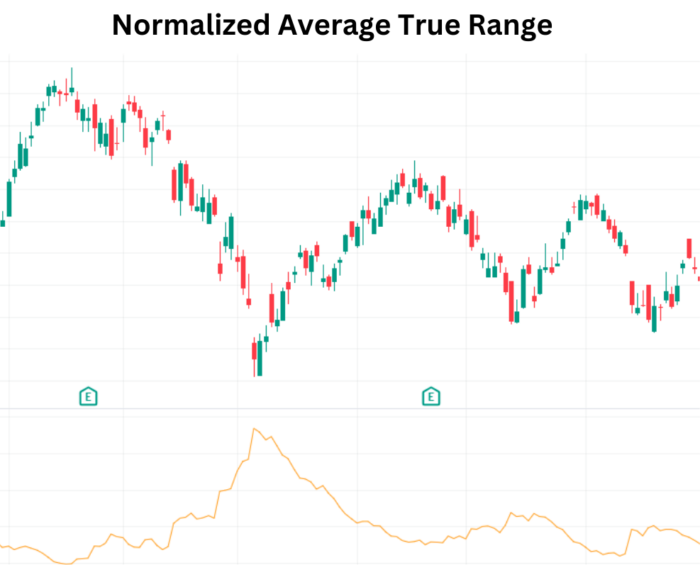
Navigating Market Volatility with Normalized Average True Range
Introduction:
In the dynamic realm of financial markets, volatility plays a pivotal role in shaping trading technical indicator. Traders seek reliable indicators to gauge and compare volatility across various price levels. One such tool that stands out is the Normalized Average True Range (NATR). This article delves into the significance of NATR, its calculation, and how traders can interpret its signals to navigate market volatility.
Understanding Normalized Average True Range (NATR):
The Normalized Average True Range (NATR) serves as a robust measure of volatility, offering traders a normalized perspective for effective comparisons across different price levels. Unlike the traditional Average True Range (ATR), NATR’s normalization feature enhances its utility in diverse market conditions.
Mathematical formula:
NATR= 100*ATR / close price
Key NATR Signals:
- Existence of Reversal:
- Assess the difference between the current Normalized Average True Range value and the previous 10 days’ minimum Normalized Average True Range value.
- If the difference exceeds 1, it signals an imminent reversal in the market, and the corresponding value is assigned as “Exist.”
- If the difference does not exceed 1, it suggests that a reversal is not likely, and the corresponding value is assigned as “Not Exist.”
- Directional Changes:
- Compare the current Normalized Average True Range value with the previous day’s NATR value.
- If the current Normalized Average True Range value is greater than the previous day’s NATR value, it indicates increased volatility, and the corresponding value is assigned as “Bearish.”
- If the current Normalized Average True Range value is less than the previous day’s Normalized Average True Range value, it suggests decreased volatility, and the corresponding value is assigned as “Bullish.”
Incorporating NATR in Trading Strategies:
- Volatility-based Reversal Signals: Leverage NATR to identify potential reversals by monitoring significant differences in volatility over a specified period.
- Trend Confirmation: Use directional changes in NATR to confirm the strength of prevailing market trends.
- Combining with Other Indicators: Enhance the effectiveness of your strategy by integrating NATR signals with complementary technical indicators.
Conclusion:
Normalized Average True Range (NATR) emerges as a valuable tool for traders navigating market volatility. Its normalization feature sets it apart, enabling traders to make meaningful volatility comparisons across different price levels. Whether signaling potential reversals or highlighting changes in market dynamics, NATR equips traders with insights to make informed decisions in the ever-changing financial landscape. As you explore volatility indicators, consider integrating NATR to refine your approach to market analysis.
xCalData is an exceptional app available for Android devices that offers unbiased insights into stocks, allowing investors to make informed decisions. With its user-friendly interface and comprehensive features, xCalData provides a valuable resource for anyone interested in the stock market. Download the app from google play.
For Actionable Intelligence, subscribe to xCalData app on Android devices: https://tinyurl.com/downloadxCalData
Popular Posts
-
Stock of Interest . August 23, 2024
#HSCL (NSE) Stock Report | 23 Aug 2024
-
Stock of Interest . August 23, 2024
Add Zerodha trading account to xCalData
-
Stock of Interest . August 23, 2024
What is xCalData , how to use it and how accurate is it?
-
Stock of Interest . August 23, 2024
Jurik Moving Average (JMA): A Profit Trading Insight