Strategy
Posted On: January 25, 2024
Navigating Trends: Williams R – KC Strategy
In the ever-evolving landscape of financial markets, traders seek strategies that provide accurate insights and enhance decision-making. The Williams R – KC Strategy, a fusion of the Williams R and Keltner Channels (KC) indicators, stands as a formidable tool for traders. By combining the momentum analysis of Williams R with the volatility insights from Keltner Channels, this strategy offers a comprehensive approach to identifying potential buy and sell signals. While the strategy demonstrates good accuracy, traders are reminded to exercise caution and manage risks effectively. In this blog post, we delve into the intricacies of the Williams R – KC Strategy, exploring the indicators, datasets, parameters, and the conditions triggering buy and sell signals by using xCaldata App.
Unveiling the Williams R – KC Strategy
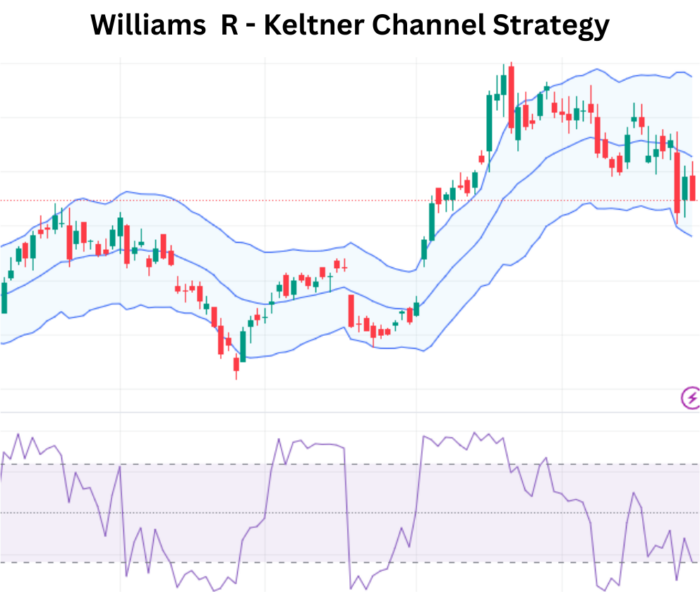
The Williams R – KC Strategy capitalizes on the synergy between the Williams R oscillator and Keltner Channels. Williams R helps identify potential overbought or oversold conditions, while Keltner Channels provide a visual representation of price volatility and potential trend reversals. By integrating these indicators, the strategy aims to provide traders with a robust framework for navigating trends.
Key Indicators in the Strategy
- Williams R: This oscillator measures the current closing price in relation to the high-low range over a specific period. Values above -20 indicate potential overbought conditions, while values below -80 suggest potential oversold conditions.
- Keltner Channels (KC): KC consists of three key components – the upper band (KC upper), lower band (KC lower), and the central line (KC ma). KC upper and lower bands help visualize potential price volatility, while the central line represents the moving average.
Essential Datasets for Implementation
For effective implementation of the Williams R – KC Strategy, traders rely on three crucial datasets:
- Technical Data: This dataset encompasses various technical indicators, with a focus on Williams R and KC values. Technical analysis forms the foundation of the strategy.
- Price Data: Essential for calculating indicators and identifying buy/sell signals, price data provides information on opening, closing, high, and low prices.
- Calendar Data: Timely market events and economic releases are essential for understanding broader market dynamics and enhancing decision-making.
Key Parameters Guiding the Strategy
The successful execution of the Williams R – KC Strategy hinges on specific parameters:
- Previous Technical Data: Access to the previous 2 days’ technical data is crucial for trend analysis and signal generation.
- Williams R Value: Defining the threshold for Williams R helps identify potential overbought or oversold conditions.
- KC Interpretation Value: Understanding the significance of the KC ma line provides a reference point for interpreting trend direction.
Buy and Sell Conditions
Buy:
- Initiate a buy position when Williams R is above 50, indicating potential bullish conditions, and the current price is above the KC ma line, suggesting an upward trend.
Sell:
- Execute a sell position when Williams R is below 50, signaling potential bearish conditions, and the current price is below the KC ma line, indicating a downward trend.
Conclusion: Precision in Trend Navigation
In conclusion, the Williams R – KC Strategy equips traders with a powerful tool for precision in trend navigation. By synergizing the insights from Williams R and Keltner Channels, traders gain a comprehensive understanding of potential market movements. However, given the inherent risks, traders are advised to approach this strategy with caution and implement effective risk management strategies. As the Williams R – KC Strategy becomes an integral part of a trader’s toolkit, it enhances precision and offers valuable insights in the ever-changing landscape of financial markets.
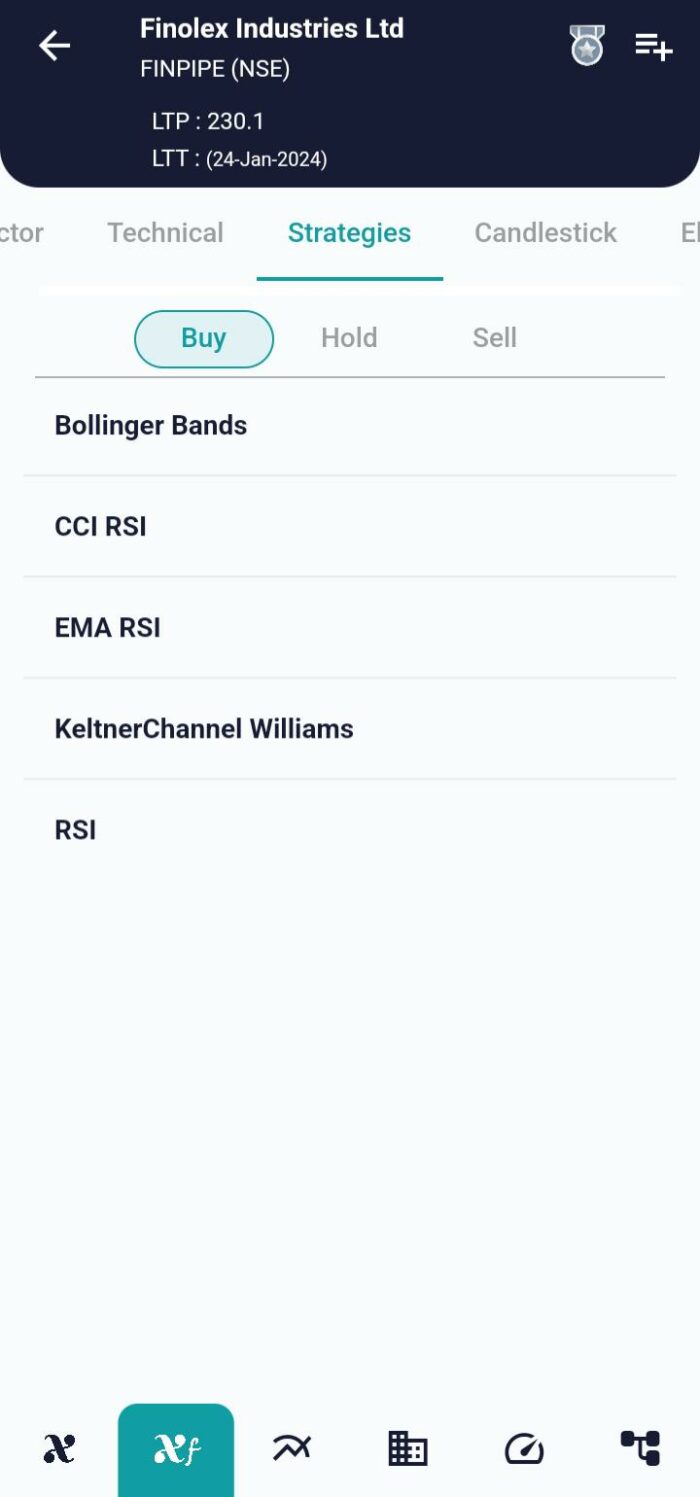
xCalData is an exceptional app available for Android devices that offers unbiased insights into stocks, allowing investors to make informed decisions. With its user-friendly interface and comprehensive features, xCalData provides a valuable resource for anyone interested in the stock market. Download the app from google play.
For Actionable Intelligence, subscribe to xCalData app on Android devices: https://tinyurl.com/downloadxCalData
Popular Posts
-
Stock of Interest . August 23, 2024
#HSCL (NSE) Stock Report | 23 Aug 2024
-
Stock of Interest . August 23, 2024
Add Zerodha trading account to xCalData
-
Stock of Interest . August 23, 2024
What is xCalData , how to use it and how accurate is it?
-
Stock of Interest . August 23, 2024
Jurik Moving Average (JMA): A Profit Trading Insight