Strategy
Posted On: January 25, 2024
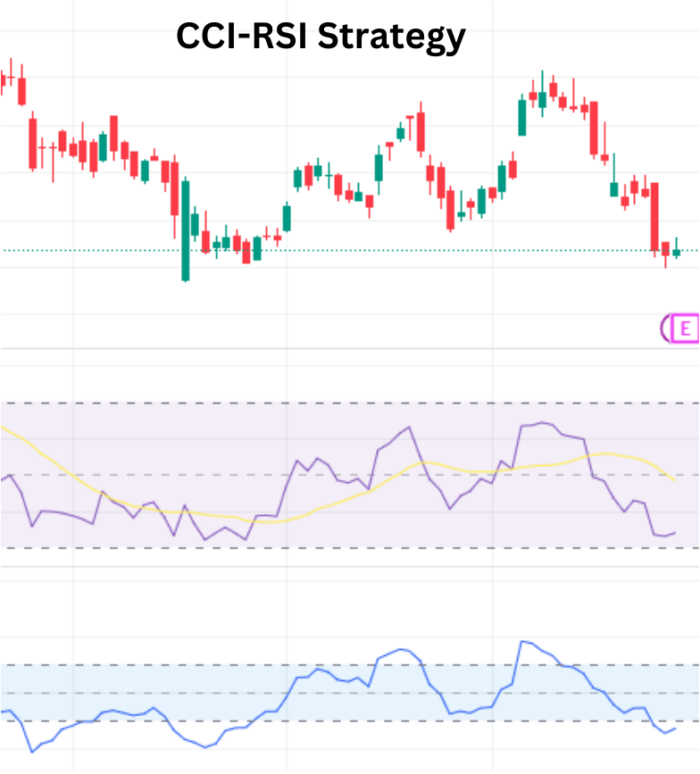
Navigating Trends with CCI – RSI Strategy
In the dynamic landscape of trading strategies, the combination of Commodity Channel Index (CCI) and Relative Strength Index (RSI) brings forth a comprehensive approach. By intertwining the insights from CCI and RSI, this strategy aims to navigate trends and capitalize on potential market opportunities. While offering promising accuracy, it’s crucial for traders to be mindful of inherent risks and approach this strategy with calculated decision-making. This blog post seeks to unveil the intricacies of the CCI – RSI Strategy, exploring the indicators, datasets, parameters, and the conditions triggering buy and sell signals by using xCaldata App.
Introduction to the CCI – RSI Strategy
The CCI – RSI Strategy amalgamates the strengths of two pivotal indicators – CCI and RSI. CCI helps identify cyclical trends, while RSI gauges momentum. The synergistic use of these indicators provides traders with a robust tool for making informed decisions, capturing potential market movements.
Indicators Utilized in the Strategy
To effectively implement the CCI – RSI Strategy, traders rely on two key indicators:
- Commodity Channel Index (CCI): CCI measures the statistical variation from the average price to identify overbought or oversold conditions. Values above 100 suggest overbought conditions, while values below -100 indicate oversold conditions.
- Relative Strength Index (RSI): RSI is a momentum oscillator that measures the speed and change of price movements. Values above 70 suggest overbought conditions, while values below 30 indicate oversold conditions.
Datasets Utilized in the Strategy
Three essential datasets contribute to the strategy’s effectiveness:
- Technical Data: This dataset includes various technical indicators, prominently CCI and RSI. Technical analysis forms the cornerstone of the strategy.
- Price Data: Essential for calculating indicators and identifying buy/sell signals, price data provides information on opening, closing, high, and low prices.
- Calendar Data: Timely market events and economic releases are crucial for understanding broader market dynamics and enhancing decision-making.
Key Parameters of the Strategy
The CCI – RSI Strategy relies on specific parameters for effective implementation:
- Previous Technical Data: Access to the previous 15 days’ technical data for a single business day is crucial for analyzing trends and momentum.
- RSI Value: This parameter involves the specific RSI value, guiding buy/sell decisions. A value above 50 suggests potential bullish momentum.
- CCI Value: The CCI value is integral to the strategy. A CCI value above 0 indicates potential bullish conditions.
Buy/Sell Conditions
Buy:
- Initiate a buy position when the previous RSI is below 50, and CCI is below 0. If the current RSI rises above 50 and CCI is above 0, it generates a buy signal, suggesting potential bullish momentum.
Sell:
- Execute a sell position when the price falls below the Simple Moving Average (SMA) of the last 14 periods. This condition suggests potential bearish sentiment and triggers a sell signal.
Conclusion: Navigating Market Trends
In conclusion, the CCI – RSI Strategy equips traders with a potent tool for navigating market trends. By combining the insights derived from CCI and RSI, traders can make informed decisions. However, given the inherent risks, traders must exercise caution and adapt to evolving market conditions. As this strategy becomes an integral part of a trader’s toolkit, it enhances precision and opens doors to potential opportunities in the ever-evolving landscape of financial markets.
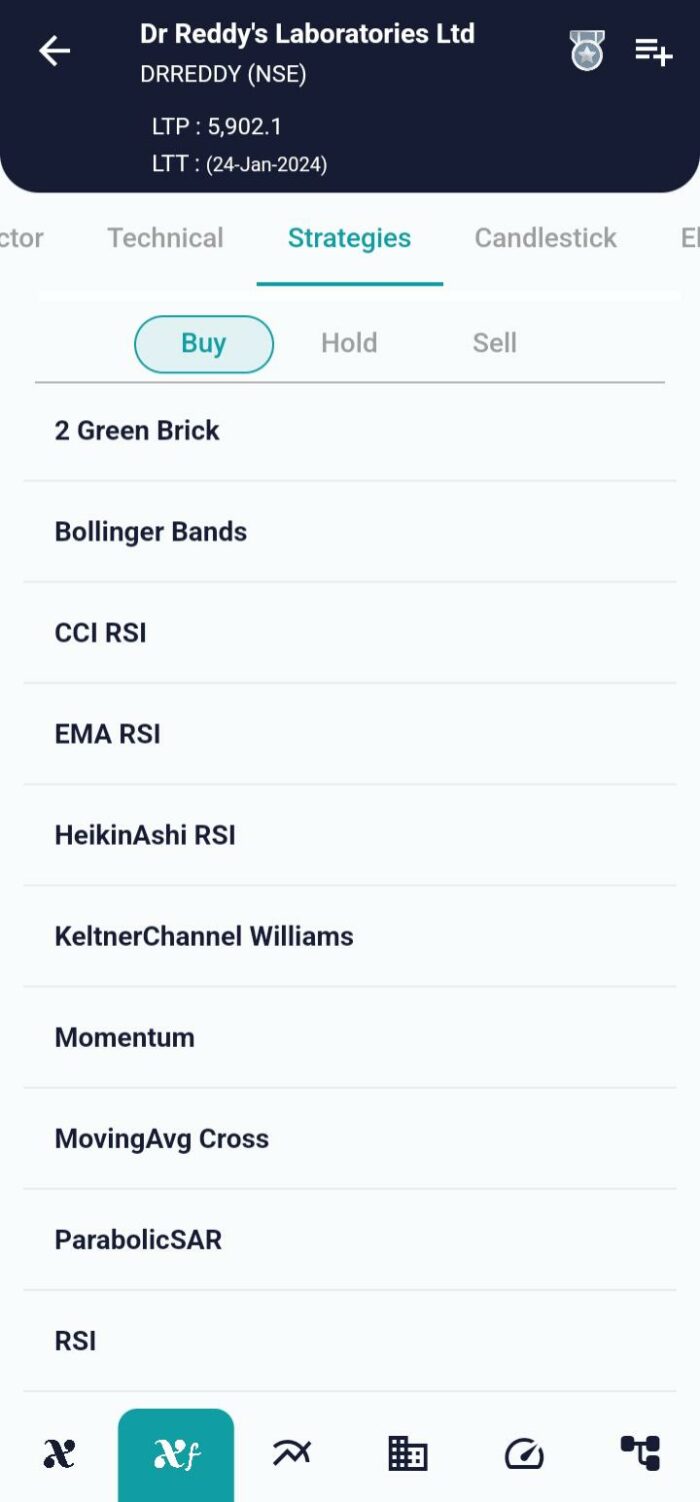
xCalData is an exceptional app available for Android devices that offers unbiased insights into stocks, allowing investors to make informed decisions. With its user-friendly interface and comprehensive features, xCalData provides a valuable resource for anyone interested in the stock market. Download the app from google play.
For Actionable Intelligence, subscribe to xCalData app on Android devices: https://tinyurl.com/downloadxCalData
Popular Posts
-
Stock of Interest . August 23, 2024
#HSCL (NSE) Stock Report | 23 Aug 2024
-
Stock of Interest . August 23, 2024
Add Zerodha trading account to xCalData
-
Stock of Interest . August 23, 2024
What is xCalData , how to use it and how accurate is it?
-
Stock of Interest . August 23, 2024
Jurik Moving Average (JMA): A Profit Trading Insight