Technical Indicator
Posted On: January 30, 2024
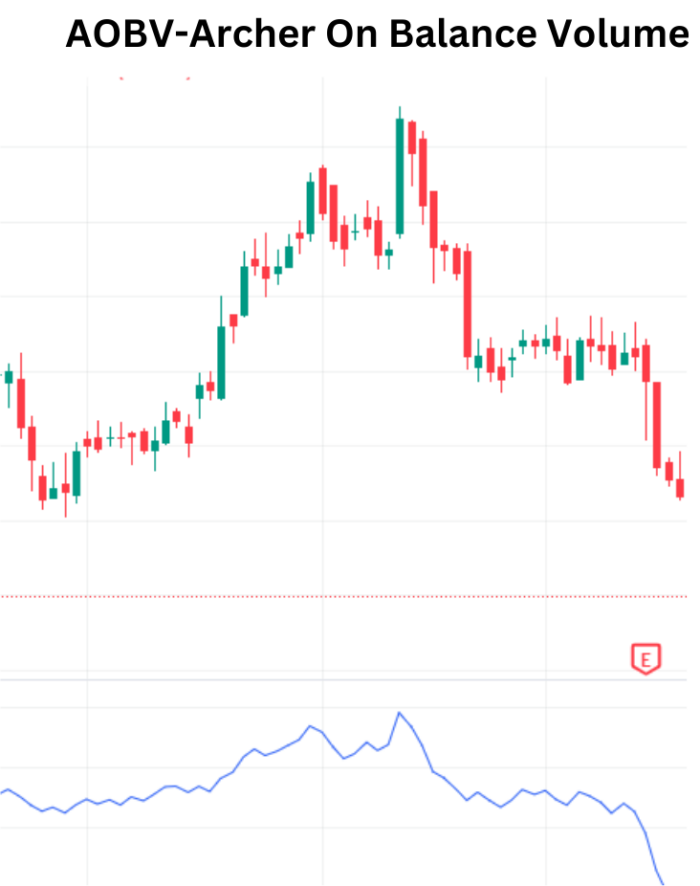
Optimizing Trading Insights with AOBV: Archer On-Balance Volume
In the dynamic realm of financial markets, traders seek innovative indicators that offer enhanced insights into price and volume movements. AOBV – Archer On Balance Volume stands as a robust improvement over the conventional On-Balance Volume (OBV) technical indicator . By incorporating Moving Averages (MAs) of OBV, AOBV introduces a nuanced approach to analyzing volume dynamics. This indicator not only refines the OBV concept but also introduces features like cloud visualization, MA customization, and the display of OBV extremes. In this blog post, we delve into the mathematical formula, interpretation, and practical applications of AOBV by using xCaldata app.
Mathematical Formula:
The computation of AOBV involves two key components: AOBV Fast and AOBV Slow.
- AOBV Fast: Calculated as the 4-period Exponential Moving Average (EMA) of OBV.
- AOBV Slow: Calculated as the 14-period EMA of OBV.
Interpretation of AOBV:
AOBV signals are derived from the relationship between AOBV Fast and AOBV Slow. The interpretation is as follows:
- Buy Signal: If the past AOBV Fast is greater than AOBV Slow, and the current AOBV Fast is less than AOBV Slow, it indicates a buy signal. This suggests a potential shift in volume dynamics favoring buying opportunities.
- Sell Signal: Conversely, if the past AOBV Fast is less than AOBV Slow, and the current AOBV Fast is greater than AOBV Slow, it indicates a sell signal. This implies a potential shift in volume dynamics favoring selling or shorting opportunities.
- Hold Signal: If none of the above conditions are met, i.e., the past and current AOBV Fast and AOBV Slow do not exhibit the specified relationships, it suggests a hold signal. Traders may choose to maintain their current positions in the absence of a clear buy or sell indication.
Practical Applications:
AOBV offers traders a comprehensive tool for analyzing both price and volume movements. Here are some practical applications of AOBV:
- Market Timing: Aligning the MA lengths and types for both price and volume aids in synchronizing timing. This correlation between price and volume enhances the understanding of market movements.
- Visualizing Volume Movements: The inclusion of cloud visualization and extreme OBV values allows traders to observe the movement of volume over a specified period. This visual representation aids in identifying trends and potential reversals.
- Market Maker Dynamics: Recognizing that volume from Market Makers plays a crucial role in price fluctuations, AOBV provides insights into the catalysts driving market movements. Understanding the interplay between price and volume is essential for making informed trading decisions.
Conclusion:
Archer On-Balance Volume (AOBV) emerges as a valuable addition to a trader’s toolkit, offering an improved perspective on volume dynamics. By incorporating MAs of OBV and introducing features for customization and visualization, AOBV provides a refined approach to analyzing market trends. Traders can leverage AOBV signals for timely decision-making, enhancing their ability to navigate the complexities of financial markets with precision and confidence.
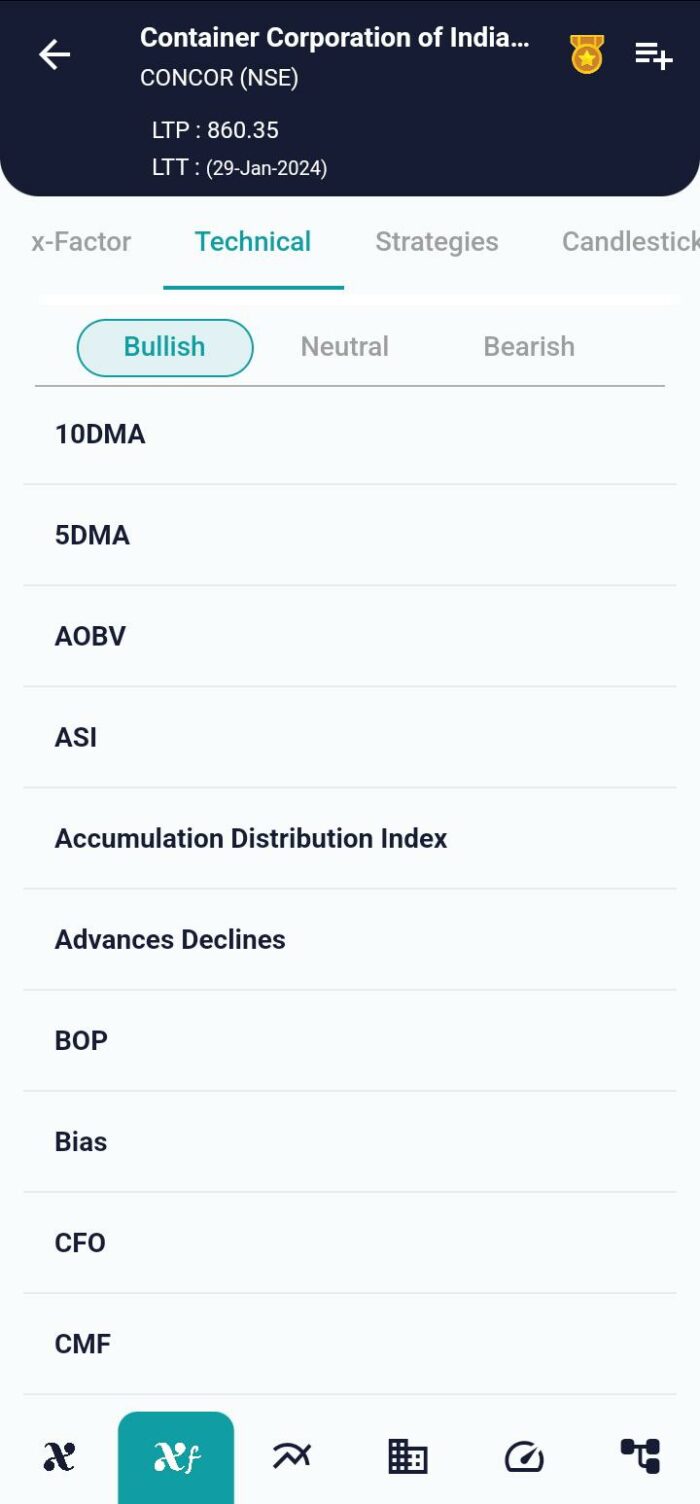
xCalData is an exceptional app available for Android devices that offers unbiased insights into stocks, allowing investors to make informed decisions. With its user-friendly interface and comprehensive features, xCalData provides a valuable resource for anyone interested in the stock market. Download the app from google play.
For Actionable Intelligence, subscribe to xCalData app on Android devices: https://tinyurl.com/downloadxCalData
Popular Posts
-
Stock of Interest . August 23, 2024
#HSCL (NSE) Stock Report | 23 Aug 2024
-
Stock of Interest . August 23, 2024
Add Zerodha trading account to xCalData
-
Stock of Interest . August 23, 2024
What is xCalData , how to use it and how accurate is it?
-
Stock of Interest . August 23, 2024
Jurik Moving Average (JMA): A Profit Trading Insight