Knowledge Base, General
Posted On: August 29, 2024
Piotroski Score: What It Is, How to Calculate It, and How to Use It in xCalData
In the world of investing, financial metrics are invaluable tools that help investors assess the health of a company. Among these tools is the Piotroski Score, a highly effective measure for evaluating a company’s financial strength. In this blog, we will explore what the Piotroski Score is, how it is calculated, and how investors can use it, including a step-by-step guide on how to find and use the Piotroski Score in xCalData to make more informed decisions.
Table of Contents
- What is the Piotroski Score?
- Why is the Piotroski Score Important?
- How is the Piotroski Score Calculated?
- Profitability (4 Points)
- Leverage, Liquidity, and Source of Funds (3 Points)
- Operating Efficiency (2 Points)
- Interpreting the Piotroski Score
- How to Find and Use the Piotroski Score in xCalData
- Step-by-Step Guide to Accessing Piotroski Score in xCalData
- Advantages of Using Piotroski Score in xCalData
- Limitations of the Piotroski Score
- Conclusion
What is the Piotroski Score?
The Piotroski Score, named after its creator, accounting professor Joseph Piotroski, is a score ranging from 0 to 9. It evaluates a company’s financial strength by analyzing nine key criteria across profitability, leverage, liquidity, and operational efficiency. Designed to help value investors, the Piotroski Score provides a simple way to separate financially sound companies from those that may be struggling.
Joseph Piotroski developed this score as a means of filtering out companies that appeared undervalued by traditional metrics like the price-to-book (P/B) ratio, but were financially weak. The Piotroski Score adds an extra layer of analysis, helping investors determine whether these stocks are likely to perform well.
Why is the Piotroski Score Important?
Identifying financially strong companies early is critical for success in value investing. While traditional metrics like the P/E ratio provide insight into a stock’s valuation, they don’t always reflect the true financial health of a company. The Piotroski Score offers a more detailed analysis by focusing on financial stability and operational performance.
Investors who use the Piotroski Score can better distinguish between undervalued stocks that are financially strong and those that are potentially high-risk. This tool helps reduce the chances of investing in companies that may be heading towards financial distress.
How is the Piotroski Score Calculated?
The Piotroski Score is calculated based on nine key criteria across three categories: Profitability, Leverage, Liquidity & Source of Funds, and Operating Efficiency. Each criterion is scored as either a 1 (if the company meets the condition) or a 0 (if it does not). The total score ranges from 0 to 9, with higher scores indicating stronger financial health. Let’s take a closer look at each category and its components:
Profitability (4 Points)
- Net Income: Is the company’s net income positive this year?
(1 point if positive) - Return on Assets (ROA): Is the return on assets positive?
(1 point if positive) - Operating Cash Flow: Is the operating cash flow positive?
(1 point if positive) - Quality of Earnings: Is the operating cash flow greater than net income?
(1 point if operating cash flow > net income)
Leverage, Liquidity, and Source of Funds (3 Points)
- Decrease in Leverage: Has the company reduced its long-term debt?
(1 point if long-term debt decreases) - Increase in Current Ratio: Has the current ratio improved, indicating stronger liquidity?
(1 point if the ratio increases) - No New Equity Issuance: Did the company avoid issuing new equity this year?
(1 point if no new equity is issued)
Operating Efficiency (2 Points)
- Increase in Gross Margin: Has the gross margin increased from the previous year?
(1 point if gross margin increases) - Increase in Asset Turnover: Is the company generating more revenue from its assets compared to the previous year?
(1 point if asset turnover increases)
Interpreting the Piotroski Score:
The Piotroski Score can be interpreted as follows:
- 7-9 Points: Companies with a high score are considered financially strong and are attractive to value investors.
- 4-6 Points: Moderate scores indicate companies with decent financial health, but further analysis may be required.
- 0-3 Points: Low scores suggest financial weakness, and investors should proceed with caution or avoid these stocks altogether.
How to Find and Use the Piotroski Score in xCalData
One of the best ways to make use of the Piotroski Score is by accessing it through the xCalData App. The app allows users to quickly filter stocks based on their Piotroski Scores and provides easy-to-use categories for assessing the financial health of different companies.
Follow these simple steps to find the Piotroski Score in xCalData:
- Open the xCalData App: Launch the app on your mobile device or desktop.
- Scroll Down to ‘Scans’: On the home screen, scroll down until you find the ‘Scans’ section.
- Click on ‘See More’: Within the ‘Scans’ section, there is an option labeled ‘More’. Click on this to expand the available scans.

- Search for ‘Piotroski’: In the new screen, you will see a search bar located in the top left corner. Type “Piotroski” into the search field and press enter.
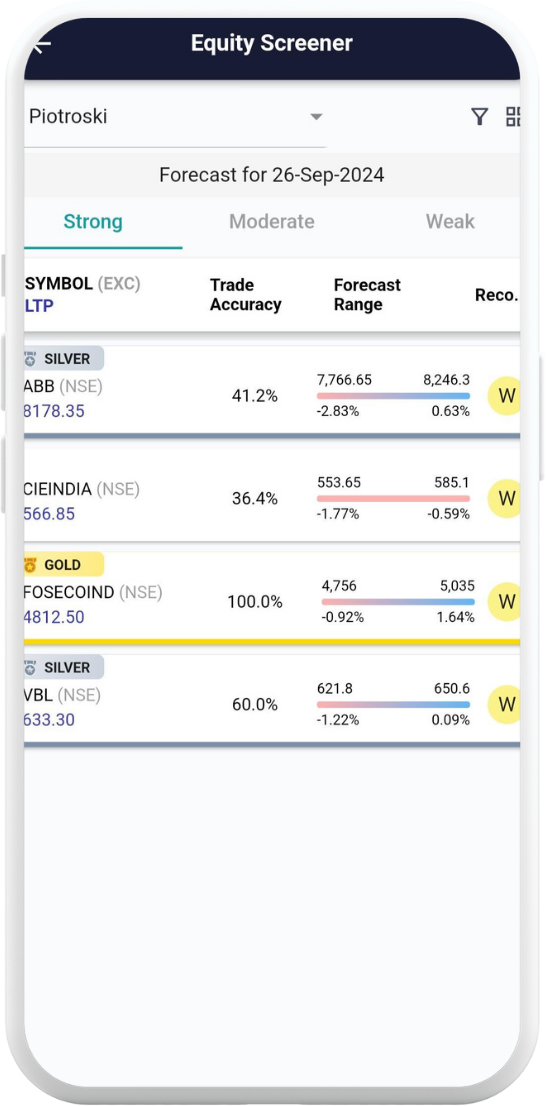
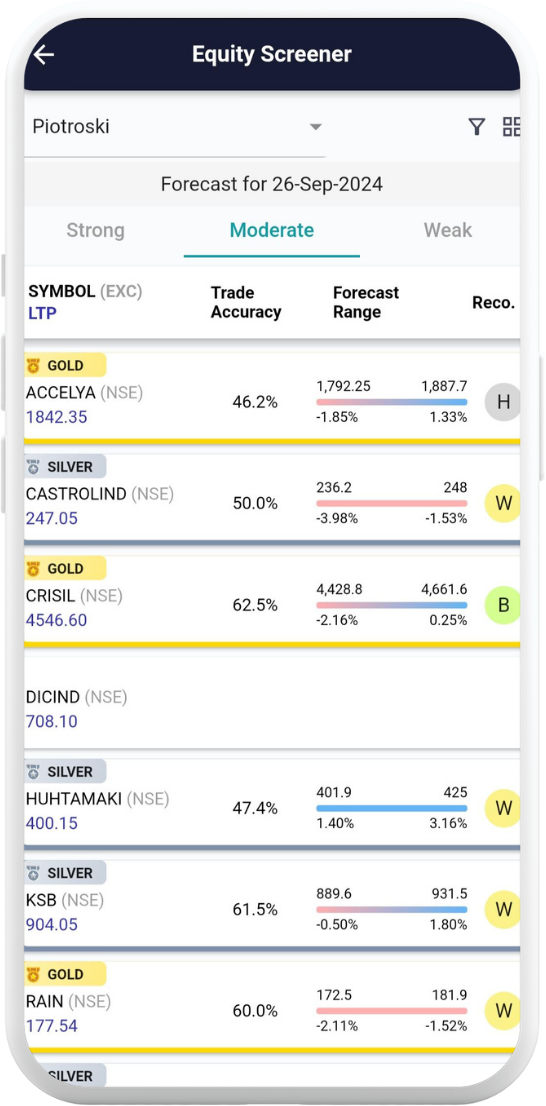
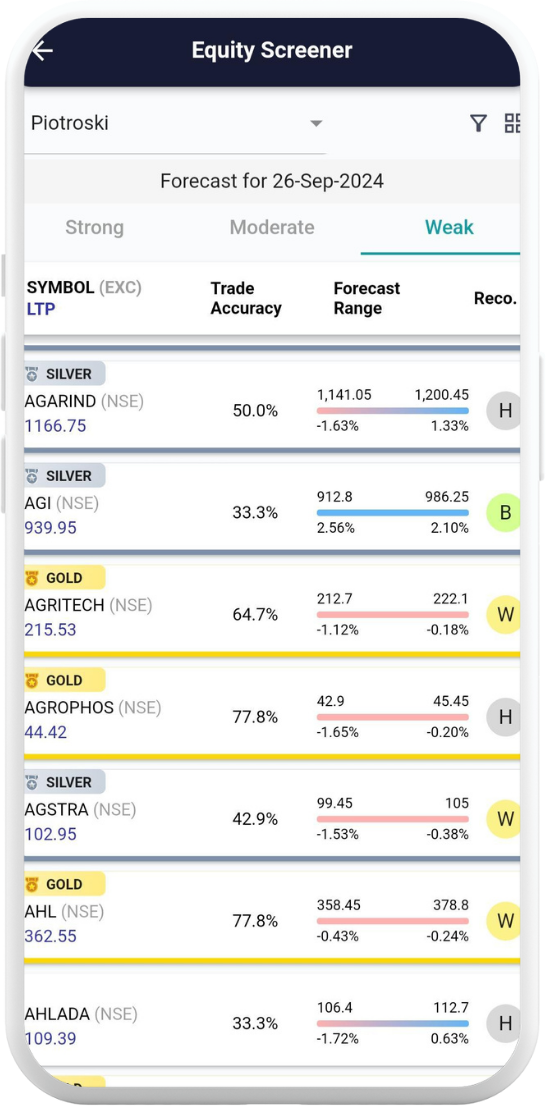
- Navigate to the Piotroski Score Page: Once you search for Piotroski, you will be taken to the Piotroski Score page, where you will see stocks categorized as Strong, Moderate, or Weak based on their scores.
- Strong Stocks: These are companies with Piotroski Scores in the 7-9 range, indicating financial strength.
- Moderate Stocks: Companies scoring between 4-6, showing moderate financial stability.
- Weak Stocks: Stocks with scores between 0-3, indicating financial weakness.
This simple workflow allows you to quickly filter stocks by their Piotroski Score, helping you find financially strong companies or avoid those with weak fundamentals.
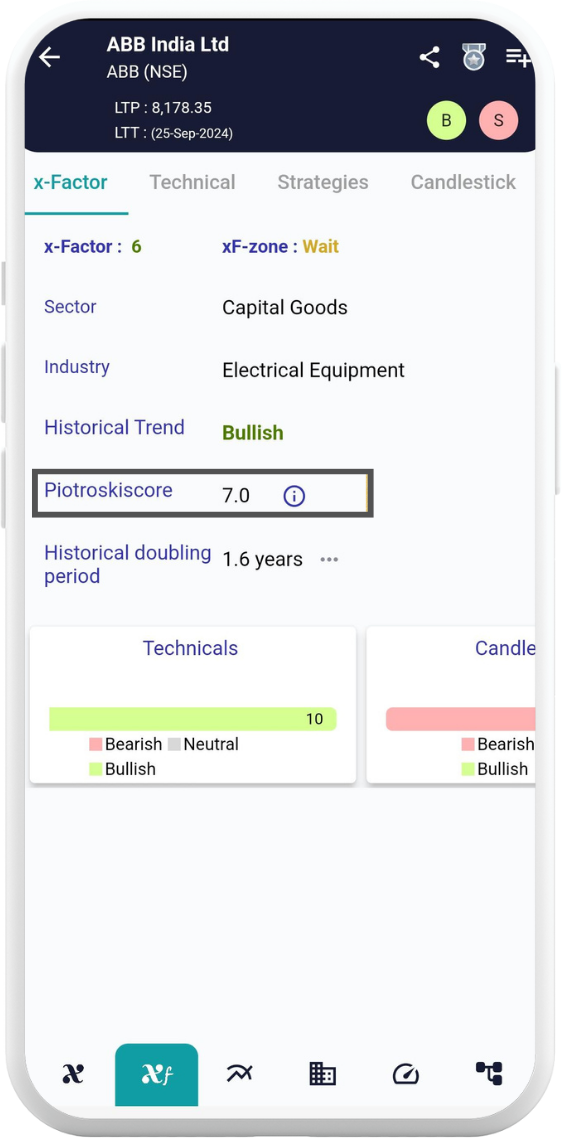
Also you can able to check the Piotroski Score in x-Factor (xf):
Advantages of Using Piotroski Score in xCalData
- Easy Accessibility: The Piotroski Score in xCalData allows you to evaluate a company’s financial health without manually calculating the score.
- Categorized Insights: By breaking down stocks into strong, moderate, and weak categories, xCalData makes it easier for investors to focus on the companies that align with their investment goals.
- Real-Time Data: The app provides real-time insights, allowing investors to make decisions based on the most recent financial data.
Limitations of the Piotroski Score
Although the Piotroski Score is a powerful tool, it has some limitations. It is based on historical data and does not factor in future growth or external market conditions. This makes it less useful for high-growth companies or sectors driven by innovation rather than stable financial performance.
For growth investors, other financial metrics and forecasts are often more relevant. However, combining the Piotroski Score with other metrics can provide a well-rounded perspective on a company’s overall strength.
Conclusion
The Piotroski Score is a crucial tool for value investors, helping them assess the financial health of a company through a simple yet effective scoring system. By following the step-by-step guide to accessing the score in xCalData, investors can quickly identify strong stocks that are worth their consideration.
With the Piotroski Score integrated into your investment strategy and xCalData’s ability to provide real-time financial data, you’ll have a clearer picture of which companies are financially sound and which ones may carry more risk.
Ready to Analyze Stocks with Piotroski Score? Download xCalData Now!
With the Piotroski Score readily available in the xCalData app, you can easily evaluate stocks and make informed investment decisions. Take your investing strategy to the next level by downloading the app today.
Thank you!!!
Happy Investing
Popular Posts
-
Stock of Interest . August 23, 2024
#HSCL (NSE) Stock Report | 23 Aug 2024
-
Stock of Interest . August 23, 2024
Add Zerodha trading account to xCalData
-
Stock of Interest . August 23, 2024
What is xCalData , how to use it and how accurate is it?
-
Stock of Interest . August 23, 2024
Jurik Moving Average (JMA): A Profit Trading Insight