Technical Indicator
Posted On: February 7, 2024
Positive Volume Index Revealed: Navigating Profitable Market Trends
Introduction:
In the intricate landscape of technical analysis, the Positive Volume Index (PVI) emerges as a valuable technical indicator , offering insights into price changes based on positive volume variations. Developed to gauge the impact of increased trading volume on market dynamics, the PVI provides traders with signals that can be instrumental in making informed decisions. This guide navigates through the intricacies of the Positive Volume Index, shedding light on its interpretation and significance in deciphering market trends.
Understanding Positive Volume Index (PVI):
The Positive Volume Index is a technical indicator designed to discern the influence of positive volume changes on price movements. It operates on the premise that heightened trading volume can serve as a precursor to significant price shifts. By focusing on positive volume variations, the PVI aims to capture the essence of buying activity driving market trends.
Mathematical Formula:
PVI=PPVI+ ((TCP−YCP)/ YCP) ×PPVI
where:
PVI=positive volume index
PPVI=previous positive volume index
TCP=today’s closing price
YCP=yesterday’s closing price
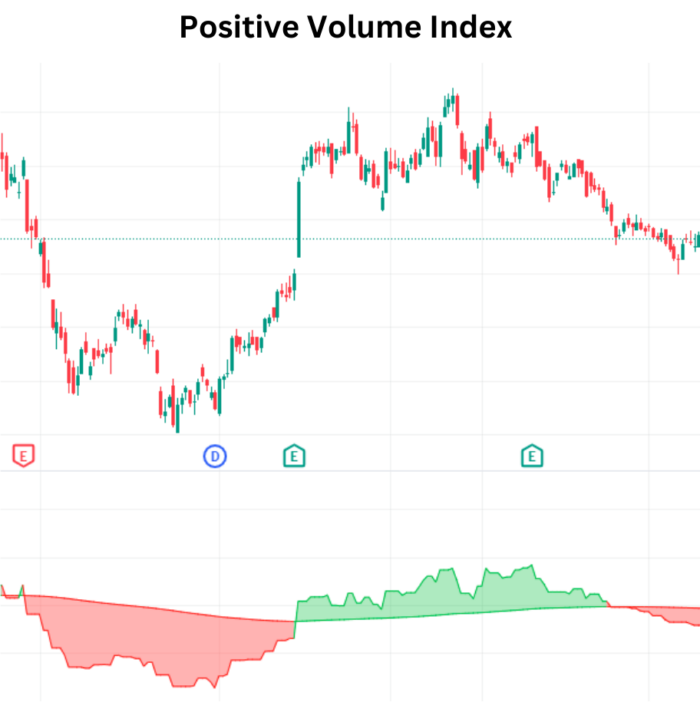
Interpreting PVI Signals:
- Bullish Signal:
- PVI > PVI_EMA: Indicates a bullish stance, suggesting that positive volume trends are influencing price movements favorably.
- Bearish Signal:
- PVI < PVI_EMA: Points to a bearish sentiment, implying that positive volume changes are not aligning with favorable price movements.
- Neutral View:
- PVI equals PVI_EMA: Suggests a neutral view, where the positive volume index is in equilibrium with its exponential moving average.
Strategies for Implementation:
- Confirmation of Bullish Trends:
- Use PVI exceeding PVI_EMA to confirm and strengthen a bullish outlook, especially when accompanied by positive price movements.
- Identification of Bearish Trends:
- A PVI lower than PVI_EMA can serve as a warning of potential bearish trends, indicating that positive volume changes may not be supporting upward price movements.
- Neutral Positioning:
- When PVI aligns closely with PVI_EMA, it signifies a neutral stance. Traders may exercise caution and assess additional indicators for a comprehensive market view.
Conclusion:
The Positive Volume Index stands as a valuable ally for traders seeking to discern the influence of positive volume changes on market trends. Its ability to provide signals for bullish, bearish, or neutral market conditions offers traders a nuanced perspective. By incorporating PVI into their technical analysis toolkit, traders can enhance their ability to anticipate and respond to market dynamics, fostering a more informed and strategic approach to trading.
xCalData is an exceptional app available for Android devices that offers unbiased insights into stocks, allowing investors to make informed decisions. With its user-friendly interface and comprehensive features, xCalData provides a valuable resource for anyone interested in the stock market. Download the app from google play.
For Actionable Intelligence, subscribe to xCalData app on Android devices: https://tinyurl.com/downloadxCalData
Popular Posts
-
Stock of Interest . August 23, 2024
#HSCL (NSE) Stock Report | 23 Aug 2024
-
Stock of Interest . August 23, 2024
Add Zerodha trading account to xCalData
-
Stock of Interest . August 23, 2024
What is xCalData , how to use it and how accurate is it?
-
Stock of Interest . August 23, 2024
Jurik Moving Average (JMA): A Profit Trading Insight