Technical Indicator
Posted On: February 2, 2024
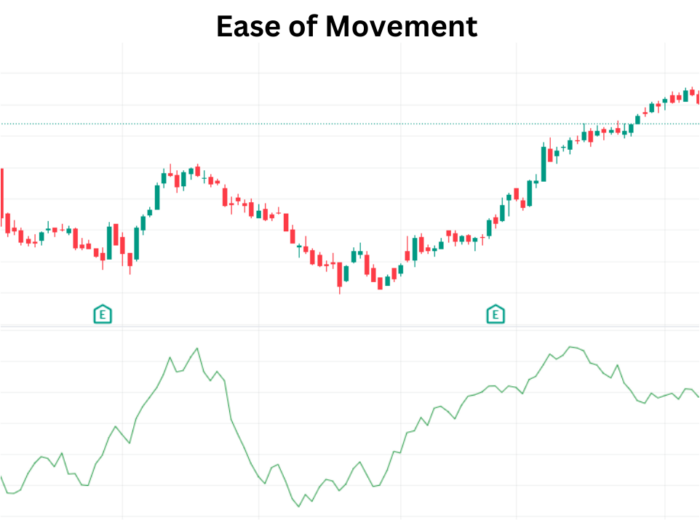
Power of the Ease of Movement Indicator to Evaluate Trends
It is critical to comprehend the relationship between price and volume in the complex world of trading. The Ease of Movement (EOM) technical indicator is one instrument that helps with this investigation. EOM reveals the relationship between price and volume and is designed to evaluate the strength of an underlying trend. It provides important insights into how easily prices can shift. Let’s examine the nuances of the Ease of Movement indicator and how to use it to make well-informed trading choices.
Demystifying the Ease of Movement Indicator
What is EOM?
The Ease of Movement technical indicator , developed by Richard W. Arms, Jr., is a momentum-based indicator that evaluates the ease with which prices move in a given direction. It takes into account both price changes and trading volume, providing a comprehensive view of market dynamics.
Calculating EOM
Distance Moved = ((H + L)/2 – (Prior H + Prior L)/2)
Box Ratio = ((V/100,000,000)/(H – L))
1-Period EOM = (Distance Moved) / (Box Ratio)
14-Period Ease of Movement = 14-Period simple moving average of 1-period EOM
Where ,
H=High
L=Low
V= Volume
Interpreting EOM Signals
- Buy Signal:
- If the current day’s Ease of Movement value is greater than 0 and the previous value is less than or equal to zero, it signals a buy opportunity.
- Indicates potential upward momentum and strength in the current trend.
- Sell Signal:
- If the current day’s Ease of Movement value is less than 0 and the previous value is greater than or equal to zero, it suggests a sell opportunity.
- Points to potential downward momentum and weakness in the current trend.
- Hold Signal:
- If none of the above conditions are met, i.e., the current day’s Ease of Movement value and the previous value fall outside the specified ranges, it’s a hold signal.
- Traders may exercise patience and await clearer signals before making decisions.
Navigating Trends with EOM: A Practical Approach
1. Confirmation with Price Trends:
- Use EOM in conjunction with price trends to confirm the strength of the current market direction.
- A rising EOM during an uptrend or a falling EOM during a downtrend enhances confidence in trend analysis.
2. Volume Analysis:
- Combine EOM with volume analysis to assess the sustainability of price movements.
- High EOM accompanied by substantial volume reinforces the validity of the current trend.
3. Risk Management:
- Implement robust risk management strategies, including stop-loss orders, to mitigate potential losses.
- EOM signals are most effective when integrated into a comprehensive risk management framework.
4. Periodic Review and Adjustment:
- Periodically review and adjust parameters based on changing market conditions.
- Adaptability is key to aligning EOM strategies with evolving market dynamics.
Case Study: EOM in Action
Consider a scenario where the EOM signals a buy opportunity, aligning with an uptrend in prices and supported by increasing volume. Traders utilizing this information may strategically enter a long position, capitalizing on the potential upward momentum.
Conclusion: Riding the Momentum Waves with EOM
As you navigate the complex currents of the financial markets, the Ease of Movement technical indicator serves as a valuable compass, guiding you through trends and helping identify potential entry and exit points. By incorporating EOM into your analytical toolkit and understanding its nuanced signals, you can gain a deeper understanding of momentum dynamics and make more informed trading decisions. Embrace the power of momentum, ride the waves with EOM, and embark on a journey toward more strategic and confident trading.
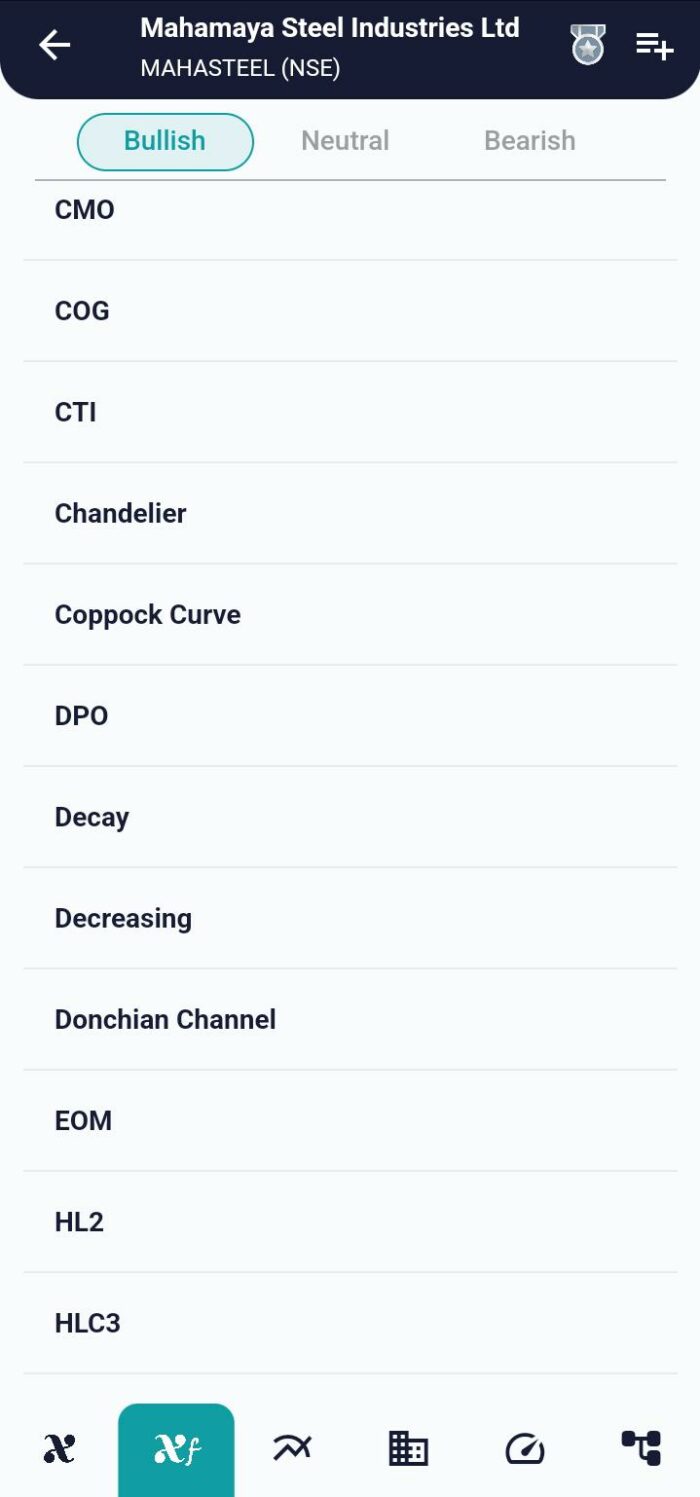
xCalData is an exceptional app available for Android devices that offers unbiased insights into stocks, allowing investors to make informed decisions. With its user-friendly interface and comprehensive features, xCalData provides a valuable resource for anyone interested in the stock market. Download the app from google play.
For Actionable Intelligence, subscribe to xCalData app on Android devices: https://tinyurl.com/downloadxCalData
Popular Posts
-
Stock of Interest . August 23, 2024
#HSCL (NSE) Stock Report | 23 Aug 2024
-
Stock of Interest . August 23, 2024
Add Zerodha trading account to xCalData
-
Stock of Interest . August 23, 2024
What is xCalData , how to use it and how accurate is it?
-
Stock of Interest . August 23, 2024
Jurik Moving Average (JMA): A Profit Trading Insight