Technical Indicator
Posted On: February 6, 2024
Power of the Midpoint Indicator for Explosive Growth
Introduction:
In the ever-evolving realm of technical analysis, traders often seek innovative technical indicator to decipher market trends. The Midpoint Indicator, a lesser-known yet effective measure, offers a unique perspective by identifying the midway point between a day’s highest high and lowest low. This dynamic indicator, which resets daily, is overlaid on the main chart, providing valuable insights into intraday price movements.
Understanding the Midpoint Indicator:
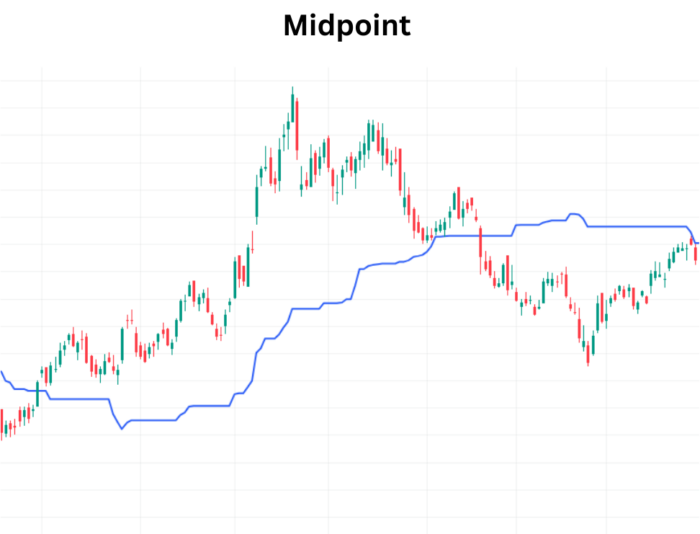
The Midpoint Indicator is a moving average that captures the equilibrium between the day’s highest high and lowest low. Resetting with each new trading day, it serves as a dynamic marker of the midpoint, allowing traders to gauge potential shifts in market sentiment and identify pivotal moments in price action.
Elements of the Midpoint Indicator:
- Calculation Formula: The Midpoint is calculated using the formula: (Current High of Day + Current Low of Day) / 2. This simple yet powerful calculation unveils the central point of intraday price movement.
- Intraday Reset: The Midpoint Indicator uniquely resets daily, aligning with the start of each trading session. This characteristic ensures that the indicator remains relevant and responsive to the nuances of intraday market dynamics.
Interpreting Midpoint Signals:
- Bullish Signal:
- When the Midpoint value shifts higher than its previous level, it generates a bullish signal. This suggests a potential upward momentum in the market, prompting traders to consider buy opportunities.
- Bearish Signal:
- Conversely, if the Midpoint value experiences a decrease from its previous level, it triggers a bearish signal. This indicates a potential downturn in market sentiment, signaling traders to explore selling opportunities.
Incorporating the Midpoint Indicator into Your Strategy:
- Dynamic Support and Resistance: Use the Midpoint Indicator as a dynamic reference point for intraday support and resistance levels.
- Confirmation with Other Indicators: Combine Midpoint signals with other technical indicators to strengthen the reliability of your trading decisions.
- Intraday Trend Reversals: Monitor Midpoint shifts for early indications of intraday trend reversals, providing valuable insights into potential market turning points.
Conclusion:
The Midpoint Indicator, with its unique calculation methodology and intraday reset, unveils a fresh perspective on market dynamics. Traders can leverage its signals to make informed decisions, whether identifying potential bullish opportunities or signaling an impending bearish shift. As you explore the vast landscape of technical indicators, consider integrating the Midpoint Indicator into your toolkit for a more comprehensive understanding of intraday price movements.
xCalData is an exceptional app available for Android devices that offers unbiased insights into stocks, allowing investors to make informed decisions. With its user-friendly interface and comprehensive features, xCalData provides a valuable resource for anyone interested in the stock market. Download the app from google play.
For Actionable Intelligence, subscribe to xCalData app on Android devices: https://tinyurl.com/downloadxCalData
Popular Posts
-
Stock of Interest . August 23, 2024
#HSCL (NSE) Stock Report | 23 Aug 2024
-
Stock of Interest . August 23, 2024
Add Zerodha trading account to xCalData
-
Stock of Interest . August 23, 2024
What is xCalData , how to use it and how accurate is it?
-
Stock of Interest . August 23, 2024
Jurik Moving Average (JMA): A Profit Trading Insight