Technical Indicator
Posted On: February 8, 2024
Power of the Slope Indicator in Profitable Trade
Introduction:
Slope Indicator:
In the vast realm of technical analysis, traders are constantly in search of tools that offer deeper insights into market trends. The Slope technical indicator emerges as a valuable ally, providing a quantitative measure of a trendline’s steepness. This article delves into the intricacies of the Slope , exploring its calculation, interpretation, and how traders can leverage it to make informed decisions in the dynamic world of financial markets..

Understanding the Slope Indicator:
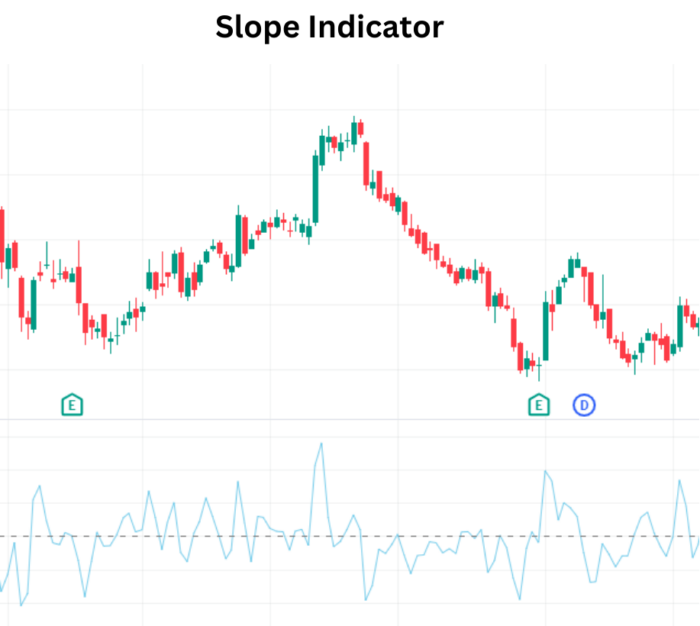
The Slope is a versatile technical analysis tool designed to measure the inclination or steepness of a trendline. By calculating the rate of change of an asset’s price over a specific period, this indicator unveils critical information about the momentum and acceleration of price movements. Whether assessing the strength of an ongoing trend or identifying potential trend reversals, the Slope equips traders with a quantitative metric to gauge market dynamics.

Calculation of the Slope Indicator:
The Slope Indicator’s calculation involves determining the rate of change of an asset’s price over a specified timeframe. This computation results in a numerical value that indicates the steepness of the trendline. A positive value suggests an upward trend, while a negative value indicates a downward trend.

Interpreting Slope Indicator Signals:
- Bullish Signal (Buy):
- Condition: The Slope value is above zero.
- Interpretation: Indicates a buy signal, signifying a positive slope and suggesting an upward trend. Traders may consider entering or reinforcing long positions.
- Bearish Signal (Sell):
- Condition: The Slope value is below zero.
- Interpretation: Signals a sell opportunity, implying a negative slope and indicating a downward trend. Traders may explore options to enter or strengthen short positions.

Practical Application of the Slope Indicator:
- Trend Confirmation:
- Utilize the Slope Indicator to confirm the strength and direction of a prevailing market trend, providing insights into potential opportunities.
- Entry and Exit Points:
- Identify potential entry and exit points by assessing changes in the slope of trendlines, enhancing precision in trading decisions.
- Confirmation with Other Indicators:
- Combine the Slope Indicator with other technical indicators to validate trend signals and refine trading strategies.
- Divergence Analysis:
- Conduct divergence analysis by comparing the Slope Indicator with price movements, identifying potential trend reversals.
- Applicability Across Timeframes:
- Apply the Slope Indicator across various timeframes, adapting its use to different trading styles and market conditions.
Conclusion:
As traders navigate the complexities of financial markets, the Slope Indicator emerges as a powerful tool for decoding trends. Its ability to quantify the steepness of trendlines provides traders with a tangible metric for assessing market momentum. By incorporating the Slope Indicator into their technical analysis toolkit, traders can make more informed decisions, whether confirming existing trends or identifying opportune moments for entry and exit. The adaptability of the Slope Indicator across different timeframes and markets positions it as a versatile ally for traders seeking a comprehensive understanding of market dynamics.
xCalData is an exceptional app available for Android devices that offers unbiased insights into stocks, allowing investors to make informed decisions. With its user-friendly interface and comprehensive features, xCalData provides a valuable resource for anyone interested in the stock market. Download the app from google play.
For Actionable Intelligence, subscribe to xCalData app on Android devices: https://tinyurl.com/downloadxCalData
Popular Posts
-
Stock of Interest . August 23, 2024
#HSCL (NSE) Stock Report | 23 Aug 2024
-
Stock of Interest . August 23, 2024
Add Zerodha trading account to xCalData
-
Stock of Interest . August 23, 2024
What is xCalData , how to use it and how accurate is it?
-
Stock of Interest . August 23, 2024
Jurik Moving Average (JMA): A Profit Trading Insight