Technical Indicator
Posted On: February 7, 2024
Power Up Trades Profitable With Percentage Volume Oscillator (PVO)
Introduction:
In the ever-evolving landscape of technical analysis, the Percentage Volume Oscillator (PVO) emerges as a powerful technical indicator , offering traders valuable insights into volume-based trends. By measuring the percentage difference between two moving averages of volume, the PVO serves as a dynamic tool for gauging market momentum. This guide delves into the intricacies of the Percentage Volume Oscillator, shedding light on its interpretation and how it can be harnessed to make informed trading decisions.

Understanding Percentage Volume Oscillator (PVO):
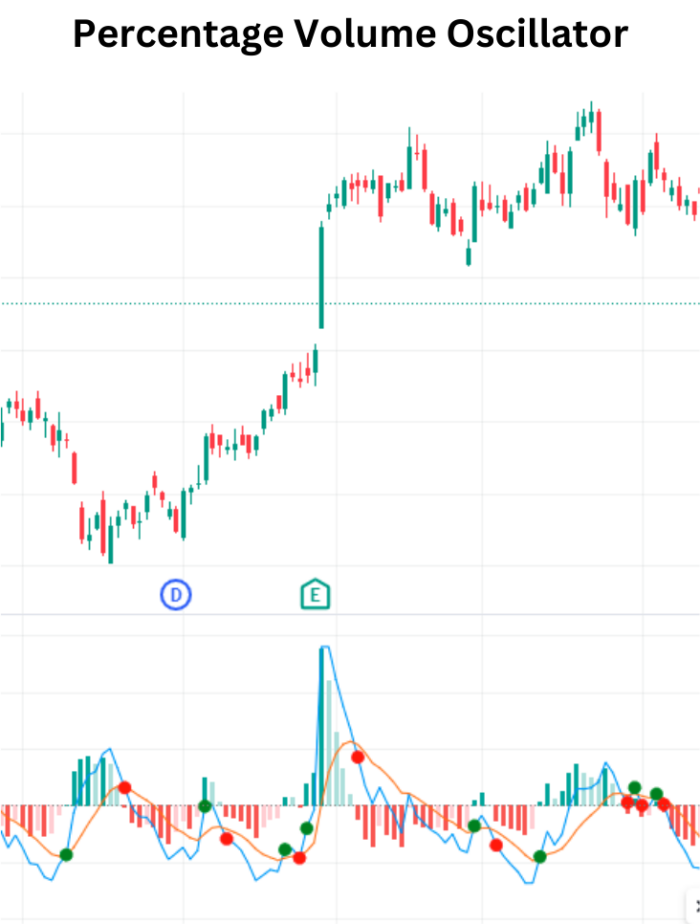
The Percentage Volume Oscillator is designed to highlight the percentage difference between two volume-based moving averages, providing a clear depiction of volume-related market trends. Similar to other oscillators like MACD, the PVO consists of a signal line, a histogram, and a centerline, making it a comprehensive tool for traders looking to decipher momentum shifts in the market.
Mathematical formula:
Src=price column
PVO = 100 * (ema (src, fastLength) – ema (src, slowLength)) / ema (src, slowLength)
signal = ema (PVO, signalLength)
hist = PVO – signal.
Interpreting PVO Signals:
- Bullish Signal:
- PVO Histogram Crossing 0 Upward: Indicates a bullish signal, suggesting positive momentum in volume trends.
- Corresponding Day Adjusted Price > 5-Day Average: Strengthens the bullish signal if the adjusted price is above the 5-day average, affirming a potential uptrend.
- Bearish Signal:
- PVO Histogram Crossing 0 Downward: Points to a bearish signal, indicating a potential shift in volume-related momentum.
- Corresponding Day Adjusted Price < 5-Day Average: Strengthens the bearish signal if the adjusted price is below the 5-day average, signaling a potential downtrend.
- Hold Position:
- PVO Histogram Not Crossing 0: Suggests a hold position, implying that the volume-based momentum is not exhibiting a decisive shift.

Strategies for Implementation:
- Confirmation of Bullish Trends:
- Use the PVO histogram crossing above 0, coupled with corresponding price strength, to confirm and strengthen a bullish outlook.
- Identification of Bearish Trends:
- A PVO histogram crossing below 0, along with corresponding weakness in price, can serve as a warning of potential bearish trends.
- Caution during Neutral Conditions:
- Exercise caution and await additional confirmatory signals when the PVO remains around the 0 value, signaling neutral market conditions.
Conclusion:
The Percentage Volume Oscillator adds a valuable dimension to technical analysis, providing traders with a nuanced perspective on volume-driven momentum. By incorporating PVO into their analytical toolkit, traders can enhance their ability to navigate market trends, make informed decisions, and stay ahead of the curve in the dynamic world of trading.
xCalData is an exceptional app available for Android devices that offers unbiased insights into stocks, allowing investors to make informed decisions. With its user-friendly interface and comprehensive features, xCalData provides a valuable resource for anyone interested in the stock market. Download the app from google play.
For Actionable Intelligence, subscribe to xCalData app on Android devices: https://tinyurl.com/downloadxCalData
Popular Posts
-
Stock of Interest . August 23, 2024
#HSCL (NSE) Stock Report | 23 Aug 2024
-
Stock of Interest . August 23, 2024
Add Zerodha trading account to xCalData
-
Stock of Interest . August 23, 2024
What is xCalData , how to use it and how accurate is it?
-
Stock of Interest . August 23, 2024
Jurik Moving Average (JMA): A Profit Trading Insight