Technical Indicator
Posted On: February 7, 2024
Powerful Navigation with the Percentage Price Oscillator (PPO)
Introduction:
Percentage Price Oscillator:
Within the domain of technical analysis, traders look for trustworthy indications to learn about the dynamics of the market and possible trend reversals. One particularly useful technical indicator that provides a percentage-based perspective of the interaction between two exponential moving averages is the Percentage Price Oscillator (PPO). We examine the PPO’s workings in this piece and offer traders advice on how to read its signals in order to make strategic decisions.
Understanding the Percentage Price Oscillator (PPO):
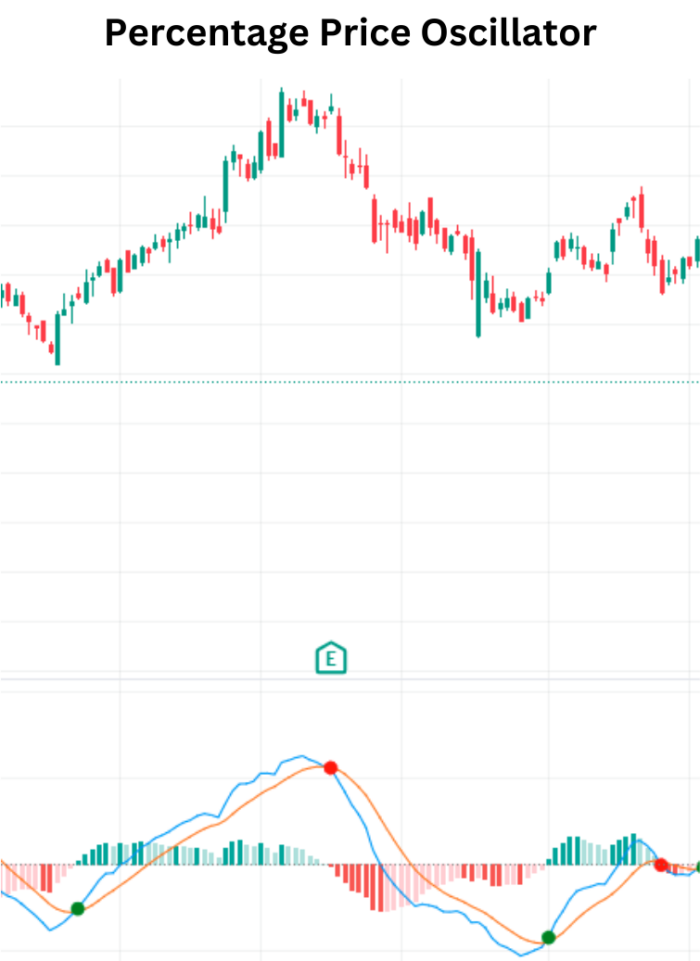
The PPO is a momentum indicator that calculates the percentage difference between two exponential moving averages (EMAs). The two EMAs used are typically a 26-period EMA (slow length) and a 12-period EMA (fast length). By expressing the difference between these moving averages as a percentage, the PPO provides a normalized view of price momentum.
PPO Formula:
Percentage Price Oscillator =100×((EMA fast−EMA slow) /EMA slow)
Signal=EMA(PPO, signal Length)
Histogram=PPO−Signal
Interpreting PPO Signals:
Traders can derive actionable insights from the PPO by analyzing its signals in different market scenarios. Here’s a breakdown of how to interpret PPO signals:
- Zero-line Crossover Signals:
- Buy Signal: When the PPO crosses the 0 value on the way up.
- Sell Signal: When the PPO crosses the 0 value on the way down.
- Hold: When the PPO is not crossing the 0 value.
- Cross Over Signals:
- Strong Buy: If both the histogram and PPO value cross the zero-line at the same point, transitioning from negative to positive.
- Strong Sell: If both the histogram and PPO value cross the zero-line at the same point, transitioning from positive to negative.
- Hold: In the absence of simultaneous zero-line crossovers.
Incorporating PPO into Trading Strategies:
- Trend Confirmation: PPO crossovers with the zero line can confirm prevailing trends, aiding traders in making informed decisions aligned with the market direction.
- Signal Confirmation: Simultaneous crossovers of the PPO and histogram at the zero line provide stronger signals, offering confirmation for traders.
- Dynamic Risk Management: Understanding the PPO signals allows traders to dynamically adjust risk exposure based on the strength of buy or sell indications.
Conclusion:
The Percentage Price Oscillator serves as a potent tool for traders seeking a percentage-based perspective on moving averages and market momentum. By interpreting zero-line crossovers and assessing the strength of signals through histogram analysis, traders can enhance their decision-making processes. Incorporating the PPO into trading strategies provides a valuable framework for navigating the complexities of financial markets with precision and confidence.
xCalData is an exceptional app available for Android devices that offers unbiased insights into stocks, allowing investors to make informed decisions. With its user-friendly interface and comprehensive features, xCalData provides a valuable resource for anyone interested in the stock market. Download the app from google play.
For Actionable Intelligence, subscribe to xCalData app on Android devices: https://tinyurl.com/downloadxCalData
Popular Posts
-
Stock of Interest . August 23, 2024
#HSCL (NSE) Stock Report | 23 Aug 2024
-
Stock of Interest . August 23, 2024
Add Zerodha trading account to xCalData
-
Stock of Interest . August 23, 2024
What is xCalData , how to use it and how accurate is it?
-
Stock of Interest . August 23, 2024
Jurik Moving Average (JMA): A Profit Trading Insight