Strategy
Posted On: January 23, 2024
Precision Fusion: RSI & MACD Strategy
In the intricate world of trading strategies, the amalgamation of the Relative Strength Index (RSI) and Moving Average Convergence Divergence (MACD) indicators introduces a powerful approach. This strategy intelligently combines the effectiveness of RSI & MACD, both recognized for their good accuracy. While showcasing promising results, it’s imperative for traders to acknowledge the inherent risks and approach this strategy with calculated decision-making. This blog post aims to dissect the nuances of the RSI & MACD Strategy, exploring its indicators, datasets, parameters, and the conditions triggering buy and sell signals.
Introduction to the RSI & MACD Strategy
The RSI & MACD Strategy leverages the robustness of two widely used indicators – RSI and MACD. RSI provides insights into the strength of price movements, while MACD reveals potential trend changes and momentum shifts. This strategic fusion aims to capitalize on the strengths of both indicators, offering traders a comprehensive tool for decision-making.
Indicators Utilized in the Strategy
To execute the RSI & MACD Strategy successfully, traders rely on two key indicators:
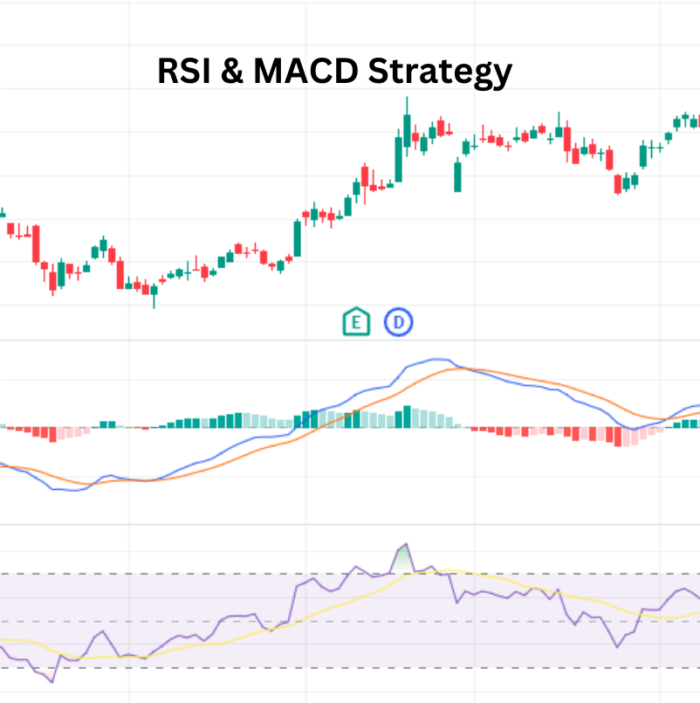
- Relative Strength Index (RSI): This momentum oscillator measures the speed and change of price movements. RSI values above 70 indicate overbought conditions, while values below 30 suggest oversold conditions.
- Moving Average Convergence Divergence (MACD): This trend-following momentum indicator illustrates the relationship between two moving averages of an asset’s price. A bullish crossover indicates potential upward momentum, while a bearish crossover suggests a potential downturn.
Datasets Utilized in the Strategy
Three vital datasets contribute to the strategy’s effectiveness:
- Technical Data: This dataset includes various technical indicators, prominently RSI and MACD. Technical analysis forms the cornerstone of the strategy.
- Price Data: Essential for calculating indicators and identifying buy/sell signals, price data provides information on opening, closing, high, and low prices.
- Calendar Data: Timely market events and economic releases are crucial for understanding broader market dynamics and enhancing decision-making.
Key Parameters of the Strategy
The RSI & MACD Strategy relies on specific parameters for effective implementation:
- Previous Technical Data: Access to the previous two days’ technical data for a single business day is crucial for trend and momentum analysis.
- RSI Value: This parameter involves the specific RSI value, guiding buy/sell decisions. A value above 50 suggests potential bullish conditions.
- MACD Interpretation Value: The MACD interpretation value is another crucial parameter influencing trading decisions. Bullish and bearish crossovers serve as key signals.
Buy/Sell Conditions
Buy:
- Initiate a buy position when the RSI value is above 50, indicating potential strength in price movements, and there is a bullish crossover in the MACD. This condition signals potential upward momentum.
Sell:
- Execute a sell position when there is a bearish crossover in the MACD. This condition suggests a potential reversal or downward momentum.
Conclusion: Precision in Dynamic Markets
In conclusion, the RSI & MACD Strategy equips traders with a comprehensive tool for navigating dynamic markets. By combining the strength analysis of RSI with the trend and momentum insights from MACD, traders can make informed decisions. However, given the inherent risks, traders must exercise caution and adapt to evolving market conditions. As this strategy becomes an integral part of a trader’s toolkit, it enhances precision and opens doors to potential opportunities in the ever-evolving landscape of financial markets.
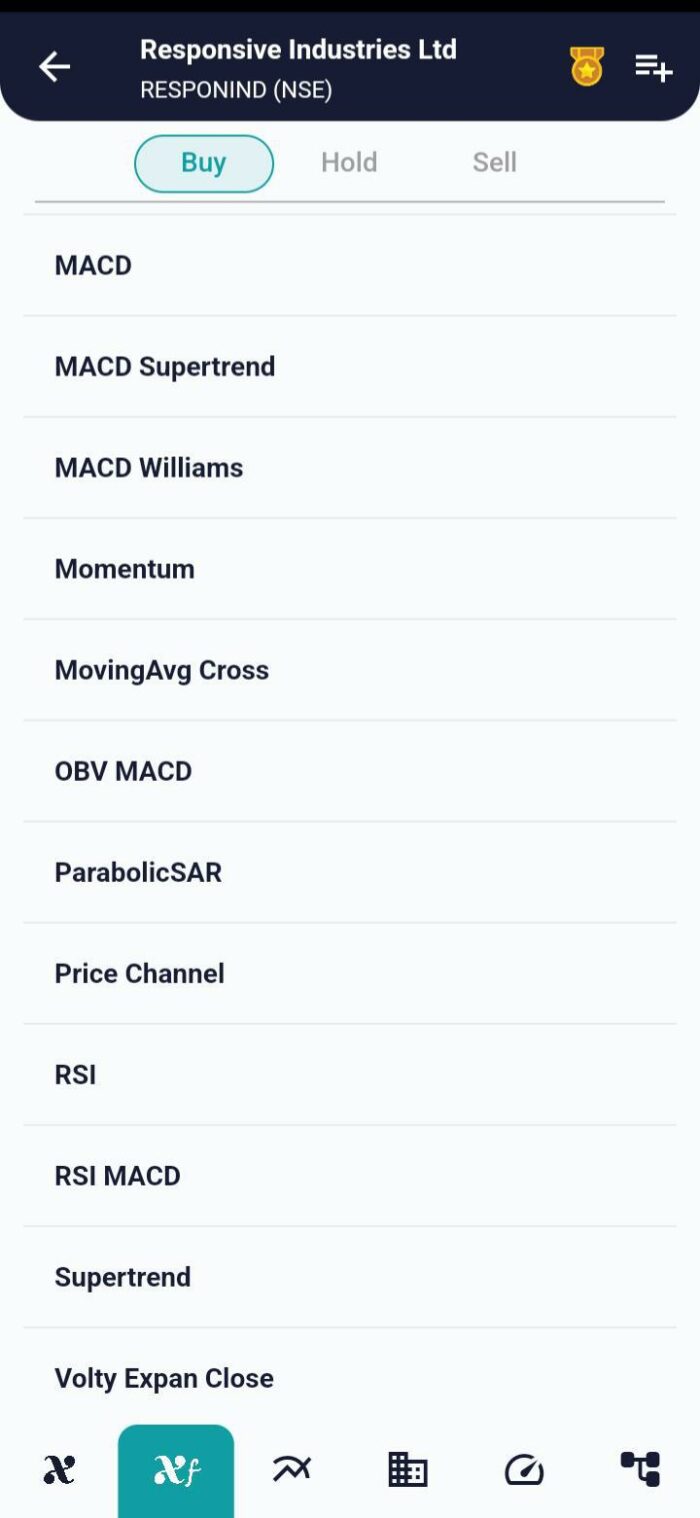
xCalData is an exceptional app available for Android devices that offers unbiased insights into stocks, allowing investors to make informed decisions. With its user-friendly interface and comprehensive features, xCalData provides a valuable resource for anyone interested in the stock market. Download the app from google play.
For Actionable Intelligence, subscribe to xCalData app on Android devices: https://tinyurl.com/downloadxCalData
Popular Posts
-
Stock of Interest . August 23, 2024
#HSCL (NSE) Stock Report | 23 Aug 2024
-
Stock of Interest . August 23, 2024
Add Zerodha trading account to xCalData
-
Stock of Interest . August 23, 2024
What is xCalData , how to use it and how accurate is it?
-
Stock of Interest . August 23, 2024
Jurik Moving Average (JMA): A Profit Trading Insight