Technical Indicator
Posted On: February 2, 2024
Profit Market with Fractal Indicator
Introduction to Fractal Indicator: Unveiling Market Chaos
In the unpredictable realm of financial markets, traders seek tools that can decipher patterns and reveal potential turning points. One such tool is the Fractal technical indicator, a powerful concept introduced by Bill Williams. This indicator aims to uncover inherent patterns in price movements, offering insights into the chaotic dynamics of the market. Let’s embark on a journey to understand the this Indicator and explore how it can enhance your trading acumen.

Unraveling the Chaos: The Essence of Fractals
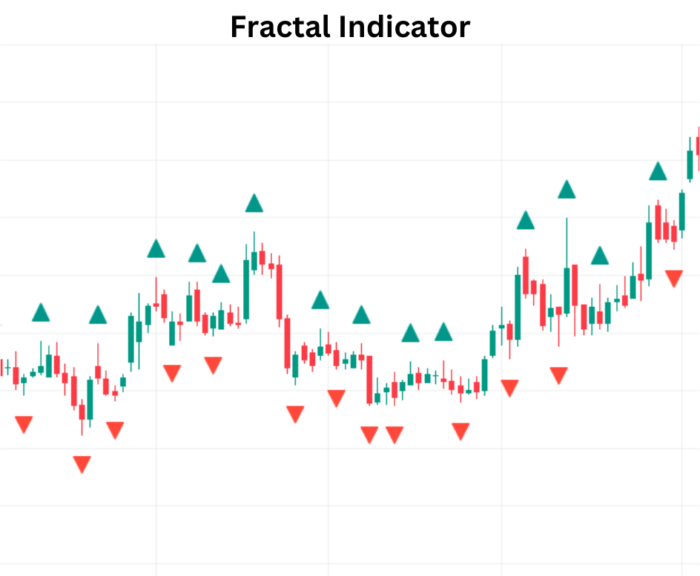
Fractals, in the context of market analysis, refer to recurring geometric patterns that can be identified in price charts. These patterns, discovered by Bill Williams, signify potential reversal points amid market chaos. This Indicator provides a lens through which traders can recognize these patterns, fostering a deeper understanding of market dynamics.
How Fractal Indicator Works: Identifying Market Turning Points
1. Fractal Formation: The Building Blocks
- Bullish Fractal: Comprising five candles, a bullish fractal forms when the middle candle has the highest high, surrounded by two lower highs on each side.
- Bearish Fractal: In contrast, a bearish fractal consists of five candles, with the middle candle having the lowest low, flanked by two higher lows on each side.
2. Recognition of Fractals: Spotting Potential Reversals
- Bullish Reversal: A bullish reversal is signaled when a bullish this Indicator appears below the previous candle’s low.
- Bearish Reversal: Conversely, a bearish reversal is indicated when a bearish this Indicator emerges above the previous candle’s high.

3. Implications for Traders: Navigating Market Trends
- Buy Signal: A buy signal is generated when a bullish fractal forms, indicating a potential upward reversal.
- Sell Signal: On the flip side, a sell signal materializes when a bearish fractal appears, pointing to a potential downturn.
The Fractal Indicator in Action: A Practical Perspective
Imagine observing a price chart where the Fractal Indicator highlights a series of bullish fractals followed by bearish fractals. This sequence could signify an upcoming shift in market dynamics, allowing traders to adjust their strategies accordingly.
Incorporating Fractals into Your Trading Arsenal
1. Confirmation with Other Indicators:
- Trend Confirmation: Use Fractal Indicator in conjunction with trend-confirming tools to validate potential reversals.
- Support and Resistance: Identify key support and resistance levels alongside fractals for a comprehensive view of price action.
2. Risk Management:
- Stop-Loss Placement: Place stop-loss orders based on fractal signals to manage risks effectively.
3. Timeframe Considerations:
- Adaptability: Adjust the timeframe based on your trading style, as fractals can be applied across various timeframes.
Conclusion: Navigating Market Complexity with Fractals
In the intricate tapestry of financial markets, the Fractal Indicator serves as a valuable guide, unveiling hidden patterns and potential reversal points. By integrating the insights gained from fractals into your trading strategy, you can navigate the complexities of market dynamics with heightened precision. Embrace the chaos, decode the patterns, and let the Fractal Indicator be your ally on the journey to trading mastery.
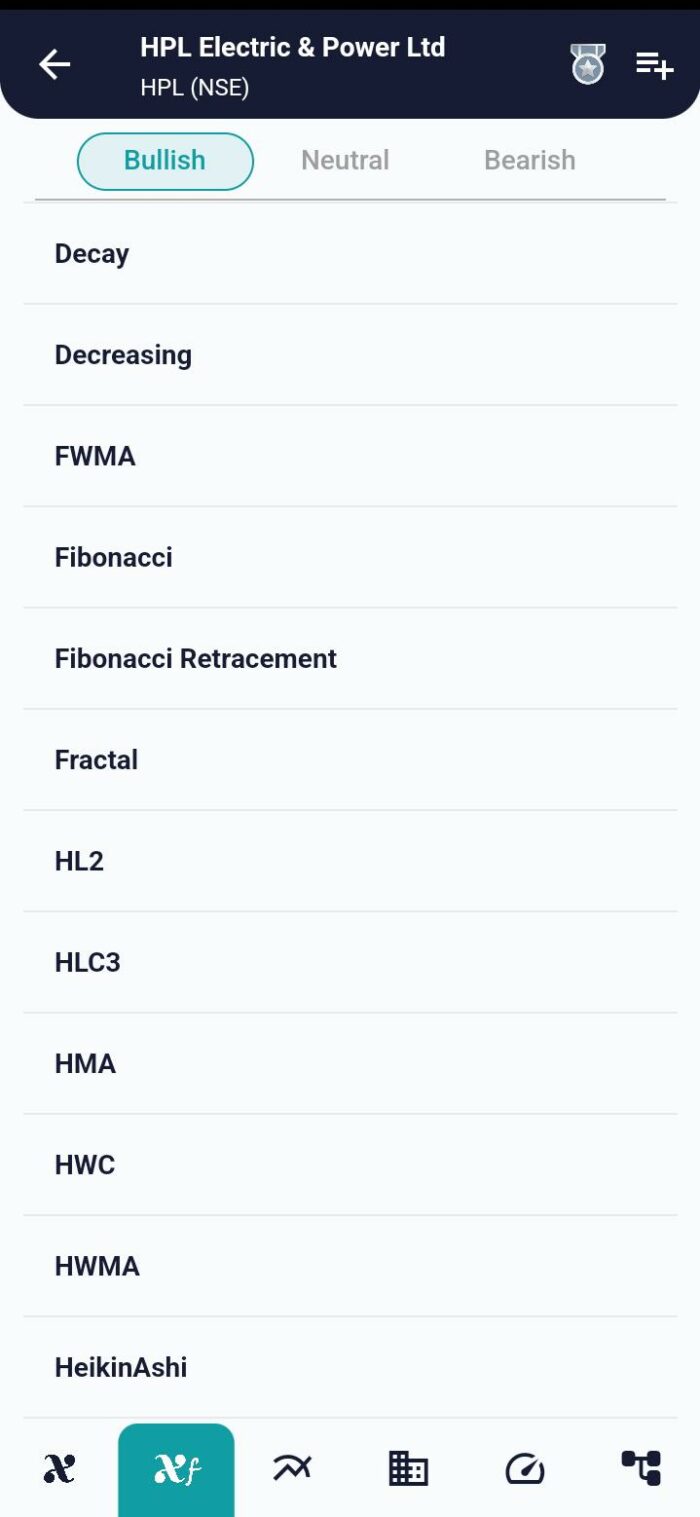
xCalData is an exceptional app available for Android devices that offers unbiased insights into stocks, allowing investors to make informed decisions. With its user-friendly interface and comprehensive features, xCalData provides a valuable resource for anyone interested in the stock market. Download the app from google play.
For Actionable Intelligence, subscribe to xCalData app on Android devices: https://tinyurl.com/downloadxCalData
Popular Posts
-
Stock of Interest . August 23, 2024
#HSCL (NSE) Stock Report | 23 Aug 2024
-
Stock of Interest . August 23, 2024
Add Zerodha trading account to xCalData
-
Stock of Interest . August 23, 2024
What is xCalData , how to use it and how accurate is it?
-
Stock of Interest . August 23, 2024
Jurik Moving Average (JMA): A Profit Trading Insight