Candlestick Pattern
Posted On: February 2, 2024
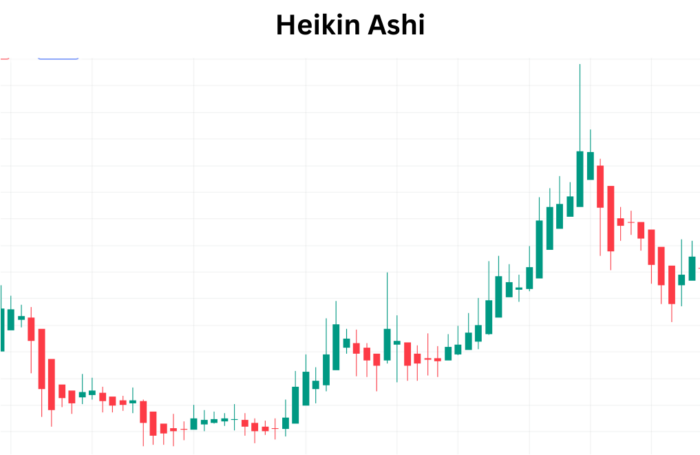
Profitable Trade With Heikin Ashi Candle Stick Pattern
Introduction to Heikin Ashi: Unraveling Candlestick Secrets
In the intricate realm of technical analysis, Heikin Ashi charts have emerged as a powerful tool, offering traders a unique perspective on price trends and market sentiment. Let’s embark on a journey to explore the nuances of Heikin Ashi and understand how it can transform your approach to deciphering financial markets.
Understanding Heikin Ashi: The Basics
1. Redefining Candlestick Construction:
- Heikin Ashi, translating to “average bar” in Japanese, reimagines traditional candlestick charts.
- Each Heikin Ashi candle considers the average price of the current period, resulting in a smoother representation.
2. Calculating Heikin Ashi Values:
- The Open, High, Low, and Close of Heikin Ashi candles are derived from the averages of the previous candle.
- This calculated approach reduces market noise and provides a clearer depiction of trends.
Interpreting Heikin Ashi Signals: Navigating Trends with Confidence
Bullish Signals:
1. Heikin Ashi Candle Color:
- A green (or white) Heikin Ashi candle signals a strong bullish trend.
- The closing price is higher than the opening price, reflecting positive market sentiment.
2. Bullish Continuation Patterns:
- Identifying patterns like consecutive green candles indicates a sustained bullish trend.
- Traders can leverage these patterns for informed decision-making.
Bearish Signals:
1. Heikin Ashi Candle Color:
- A red (or black) Heikin Ashi candle suggests a bearish sentiment.
- The closing price is lower than the opening price, signaling potential downward pressure.
2. Bearish Continuation Patterns:
- Successive red candles indicate a prolonged bearish trend, offering insights for strategic exits or short positions.
Integrating Heikin Ashi into Your Trading Strategy: Practical Insights
1. Confirmation with Traditional Indicators:
- Combine Heikin Ashi analysis with traditional indicators like Moving Averages or RSI for added confirmation.
- Dual validation enhances the robustness of trading signals.
2. Identifying Trend Reversals:
- Heikin Ashi candles excel at highlighting potential trend reversals.
- Look for color transitions in candles as a precursor to shifts in market sentiment.
3. Risk Management Strategies:
- Implement effective risk management by setting stop-loss orders based on Heikin Ashi signals.
- Protect gains and limit losses with a strategic approach to risk.
Conclusion: Mastering Market Dynamics with Heikin Ashi
As you navigate the complexities of financial markets, Heikin Ashi technical indicator offer a refined lens through which to analyze trends and anticipate price movements. Embrace the unique construction of Heikin Ashi candles, and let them guide you in making informed trading decisions. Whether you’re a seasoned trader or a newcomer to the world of technical analysis, Heikin Ashi charts can be a valuable addition to your toolkit, providing clarity in the often turbulent landscape of market fluctuations.
xCalData is an exceptional app available for Android devices that offers unbiased insights into stocks, allowing investors to make informed decisions. With its user-friendly interface and comprehensive features, xCalData provides a valuable resource for anyone interested in the stock market. Download the app from google play.
For Actionable Intelligence, subscribe to xCalData app on Android devices: https://tinyurl.com/downloadxCalData
Popular Posts
-
Stock of Interest . August 23, 2024
#HSCL (NSE) Stock Report | 23 Aug 2024
-
Stock of Interest . August 23, 2024
Add Zerodha trading account to xCalData
-
Stock of Interest . August 23, 2024
What is xCalData , how to use it and how accurate is it?
-
Stock of Interest . August 23, 2024
Jurik Moving Average (JMA): A Profit Trading Insight