Technical Indicator
Posted On: February 7, 2024
Psychological Line: Navigating Market Sentiment with this Powerful Indicator
Introduction:
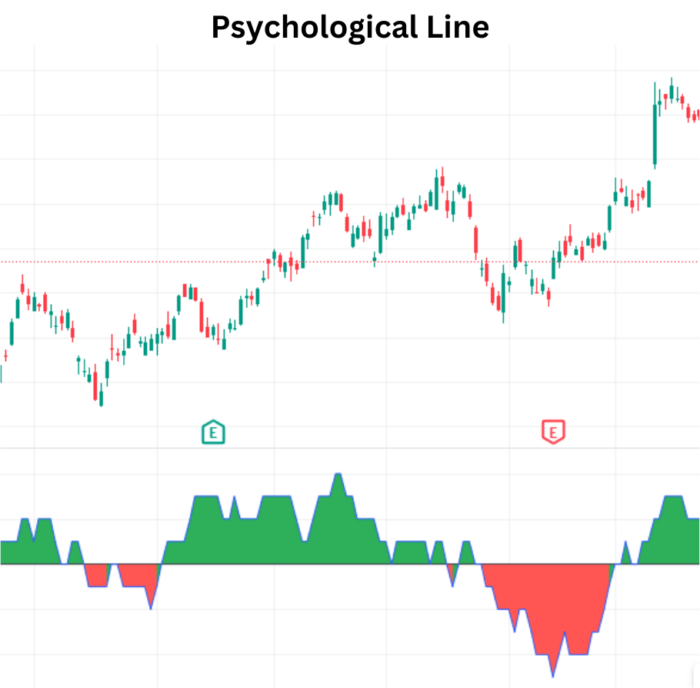
In the fast-paced realm of trading, gauging market sentiment is paramount. The Psychological Line (PSL) technical indicator stands out as a powerful tool, offering insights into the balance of buying and selling power. Developed to measure the ratio of rising periods to total periods, PSL provides a glimpse into the prevailing sentiment. This guide explores the workings of the Psychological Line, its calculation methods, and strategies for interpreting its signals.

Understanding the Psychological Line Indicator:
The Psychological Line is a dynamic metric that quantifies the ratio of rising periods within a specified timeframe. Represented as a percentage, it serves as a barometer for market sentiment. When the PSL surpasses 50%, it signals that buyers are in control; conversely, a PSL below 50% indicates dominance by sellers.
Calculation of Psychological Line:
PSL= (rising Period number within a specific period/ specific period) × 100.
Or
PSL = sum (close > close [1], Length) / Length * 100
Interpreting Psychological Line Signals:
- Bullish Signals:
- PSL between 70 to 50: Indicates a bullish sentiment, with buyers having some control over the market.
- PSL greater than 70: Reflects strong bullish sentiment, suggesting robust buying power.
- Bearish Signals:
- PSL between 30 to 50: Points to a bearish sentiment, with sellers exerting influence.
- PSL less than 30: Signifies strong bearish sentiment, indicating significant selling pressure.

Strategies for Implementation:
- Trend Confirmation:
- Use PSL to confirm the prevailing trend. A rising PSL may validate an upward trend, while a declining PSL could confirm a downward trend.
- Overbought and Oversold Conditions:
- Identify potential overbought conditions when PSL is in the strong bullish range.
- Recognize potential oversold conditions when PSL is in the strong bearish range.
- Divergence Analysis:
- Look for divergences between price and PSL. Divergence could signal a potential reversal or change in market sentiment.
Conclusion:
The Psychological Line Indicator emerges as a valuable ally for traders seeking to comprehend market sentiment. By employing its calculations and interpreting signals, traders can gain valuable insights into the dynamics of buying and selling forces. Whether confirming trends, identifying extremes, or spotting divergences, the Psychological Line equips traders with a nuanced understanding of market sentiment, aiding in informed decision-making
xCalData is an exceptional app available for Android devices that offers unbiased insights into stocks, allowing investors to make informed decisions. With its user-friendly interface and comprehensive features, xCalData provides a valuable resource for anyone interested in the stock market. Download the app from google play.
For Actionable Intelligence, subscribe to xCalData app on Android devices: https://tinyurl.com/downloadxCalData
.
Popular Posts
-
Stock of Interest . August 23, 2024
#HSCL (NSE) Stock Report | 23 Aug 2024
-
Stock of Interest . August 23, 2024
Add Zerodha trading account to xCalData
-
Stock of Interest . August 23, 2024
What is xCalData , how to use it and how accurate is it?
-
Stock of Interest . August 23, 2024
Jurik Moving Average (JMA): A Profit Trading Insight