Technical Indicator
Posted On: February 7, 2024
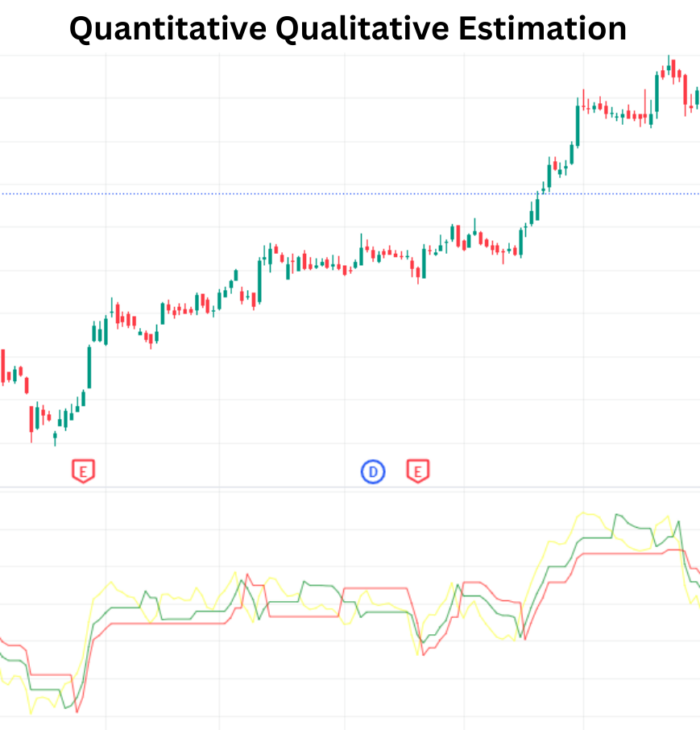
Quantitative Qualitative Estimation (QQE): Mastering Market Trends with Precision
Introduction:
The Quantitative Qualitative Estimation (QQE) technical indicator , a derivative of Wilder’s renowned Relative Strength Index (RSI), stands as a potent tool in assessing market trends and distinguishing between trend and sideways movements. This guide delves into the QQE indicator, offering insights into its interpretation and signals for traders.

Deciphering QQE Signals:
The QQE indicator generates valuable signals based on the ‘QQE Value,’ providing traders with a nuanced understanding of market conditions.
The formula for QQE (Quantitative Qualitative Estimation) :
- Calculate RSI for 14 Periods
RSI = SCALAR * POSITIVE_AVERAGE + | NEGATIVE AVERAGE |
- Compute RSI_MA by calculating 5 Period EMA for RSI
- Calculate RSI_MA_TR by taking difference for RSI_MA with 1 Drift and convert into absolute values.
- Compute SMOOTHED_RSI_MA_TR for the RSI_MA_TR by calculating 27 Period EMA.
- Compute a Slow_trailing line by calculating SMOOTHED_RSI_MA_TR by calculating 27 Period EMA and multiply it with SLOW_FACTOR
- Create Upper Band and Lower Band
- Upper band = RSI_MA + Slow_trailing_line
- Lower band = RSI_MA – Slow_trailing_line
- Calculate QQE_Value by checking these conditions
Condition 1: (c_rsi > c_short and p_rsi < p_short) or (c_rsi <= c_short and p_rsi >= p_short)
Condition 2: (c_rsi > c_long and p_rsi < p_long) or (c_rsi <= c_long and p_rsi >= p_long)
Where c = current, p = previous.
Interpretations of QQE:
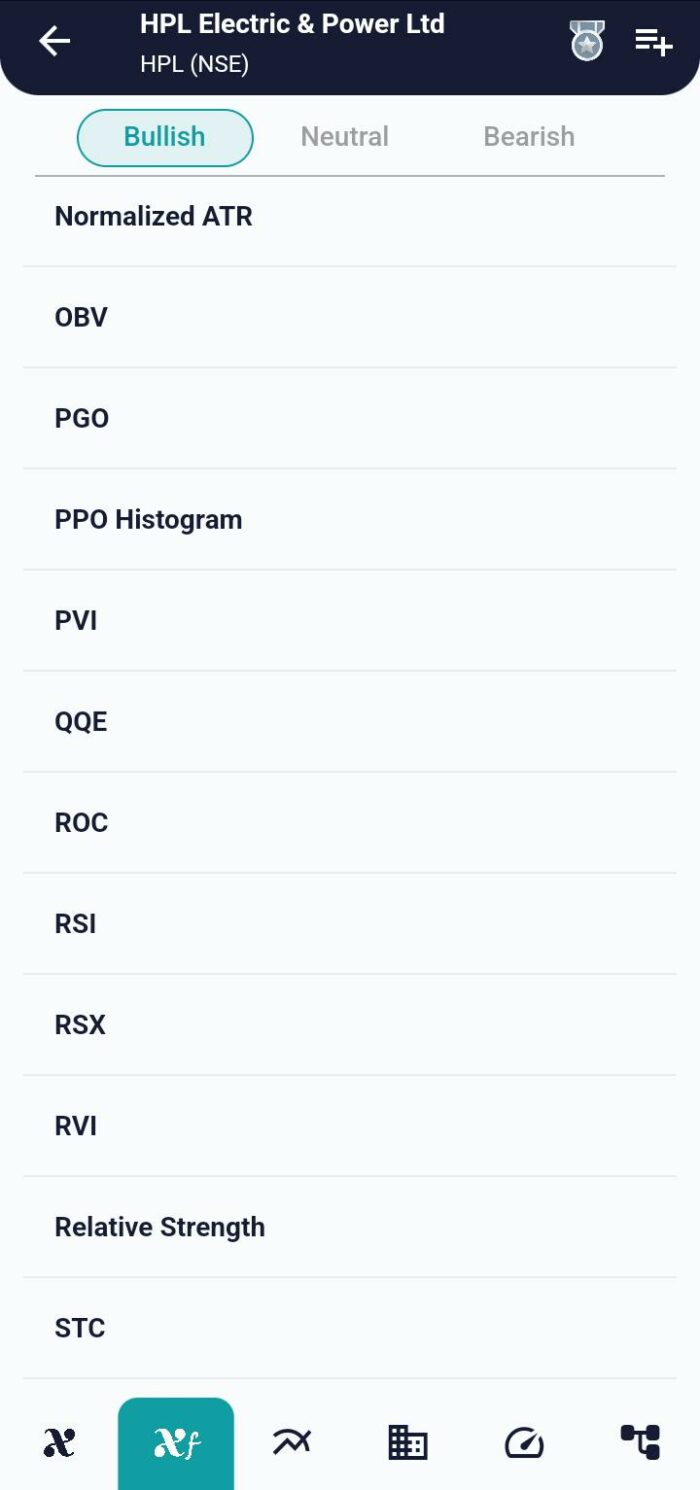
- Strong Bullish Signal:
- Condition: If the ‘QQE_Value’ surpasses 70.
- Interpretation: A ‘Strong Bullish’ signal is triggered, indicating a robust upward trend in the market.
- Bullish Signal:
- Condition: ‘QQE_Value’ is greater than 50 and less than or equal to 70.
- Interpretation: The market is ‘Bullish,’ suggesting a favorable environment for buyers.
- Bearish Signal:
- Condition: ‘QQE_Value’ is greater than 30 and less than or equal to 50.
- Interpretation: A ‘Bearish’ signal emerges, pointing to a potential downturn in the market.
- Strong Bearish Signal:
- Condition: ‘QQE_Value’ is less than or equal to 30.
- Interpretation: A ‘Strong Bearish’ signal is activated, indicating a robust downward trend in the market.
- Neutral Signal:
- Condition: If none of the above conditions are met.
- Interpretation: The market is deemed ‘Neutral,’ suggesting a lack of clear trend direction.

Integration into Trading Strategies:
- Confirmation Tool:
- Use Quantitative Qualitative Estimation signals to confirm prevailing trends identified by other technical indicators.
- Risk Management:
- Leverage Quantitative Qualitative Estimation insights to refine risk management strategies, adjusting positions based on the identified trend signals.
- Trend Reversal Indication:
- Identify potential trend reversals by monitoring Quantitative Qualitative Estimation signals in conjunction with other technical analysis tools.
Conclusion:
Mastering the Quantitative Qualitative Estimation indicator empowers traders to navigate the dynamic landscape of financial markets with precision. By interpreting Quantitative Qualitative Estimation signals, traders can make informed decisions, optimize entry and exit points, and gain a deeper understanding of market trends.
xCalData is an exceptional app available for Android devices that offers unbiased insights into stocks, allowing investors to make informed decisions. With its user-friendly interface and comprehensive features, xCalData provides a valuable resource for anyone interested in the stock market. Download the app from google play.
For Actionable Intelligence, subscribe to xCalData app on Android devices: https://tinyurl.com/downloadxCalData
Popular Posts
-
Stock of Interest . August 23, 2024
#HSCL (NSE) Stock Report | 23 Aug 2024
-
Stock of Interest . August 23, 2024
Add Zerodha trading account to xCalData
-
Stock of Interest . August 23, 2024
What is xCalData , how to use it and how accurate is it?
-
Stock of Interest . August 23, 2024
Jurik Moving Average (JMA): A Profit Trading Insight