Candlestick Pattern
Posted On: February 13, 2024
Rickshaw Man Pattern: Navigating Market Indecision with Precision
In the intricate landscape of financial markets, traders deploy a diverse set of technical analysis tools to decipher potential trend reversals and market dynamics. Candlestick patterns, known for their ability to provide actionable insights, play a crucial role in this endeavor. The Rickshaw Man pattern is one such candlestick formation that demands attention from traders, acting as a signal for potential market indecision. In this blog post, we will explore the concept of the Rickshaw Man pattern, delve into its identification process, and discuss how traders can interpret this pattern to refine their trading strategies.
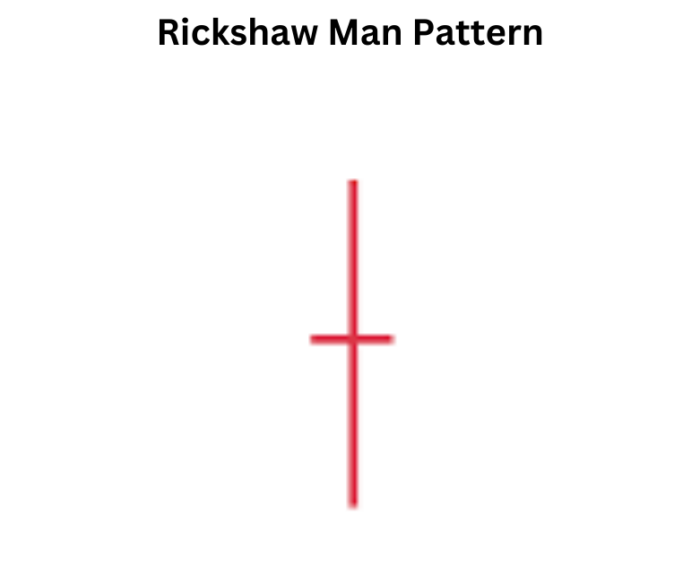
The Rickshaw Man pattern is a single-candlestick formation that typically manifests during periods of market indecision, representing a balance between bulls and bears. It is characterized by a small real body with long upper and lower shadows (wicks), resembling a person carrying a rickshaw.
Identifying the Rickshaw Man Pattern:
To identify the Rickshaw Man pattern, traders should pay close attention to the following key features:
- Small Real Body: The candlestick has a small real body, indicating limited price movement during the trading period.
- Long Upper and Lower Shadows: The upper and lower shadows (wicks) are long, suggesting a tug-of-war between buyers and sellers.
Interpreting the Rickshaw Man Pattern:
The Rickshaw Man pattern implies market indecision and a lack of clear dominance by either bulls or bears. The long upper and lower shadows indicate that neither buyers nor sellers were able to establish control during the trading period. Traders interpret this pattern as a signal to exercise caution and monitor the market closely for potential changes in direction.
Confirmation and Trade Execution:
While the Rickshaw Man pattern provides insights into market indecision, traders often seek supplementary confirmation before making trading decisions. They may consider the following factors:
- Volume Confirmation: An increase in trading volume during the Rickshaw Man pattern may signal increased volatility and potential shifts in market sentiment.
- Support and Resistance Levels: Identifying key support and resistance levels can further validate the pattern’s significance and guide in setting realistic price targets.
- Trend Analysis: Integrating the Rickshaw Man pattern with broader trend analysis helps traders understand whether it is occurring within an established trend or signaling a potential reversal.
Conclusion:
The Rickshaw Man pattern serves as a valuable tool for traders, offering insights into market indecision and the potential for a change in direction. By understanding its identification process and adeptly interpreting this pattern, traders can refine their trading strategies.
However, it’s crucial to recognize that the Rickshaw Man pattern, like any other technical indicator, is not foolproof. Informed trading decisions necessitate additional verification and comprehensive analysis. As with any trading strategy, risk management and prudent decision-making remain paramount for traders navigating the complexities of financial markets.
Where can I see further insights on this stock?
xCalData offers unbiased insights into stocks. Download the app from google play. For Actionable Intelligence, subscribe to xCalData app on Android devices: Download here
For Actionable Intelligence, subscribe to xCalData app on Android devices: https://tinyurl.com/downloadxCalData

Disclaimer: The securities quoted are for illustration only and are not recommendatory.
Popular Posts
-
Stock of Interest . August 23, 2024
#HSCL (NSE) Stock Report | 23 Aug 2024
-
Stock of Interest . August 23, 2024
Add Zerodha trading account to xCalData
-
Stock of Interest . August 23, 2024
What is xCalData , how to use it and how accurate is it?
-
Stock of Interest . August 23, 2024
Jurik Moving Average (JMA): A Profit Trading Insight