Technical Indicator
Posted On: February 6, 2024
Strong Ride On Market Waves with Momentum Indicator
Introduction:
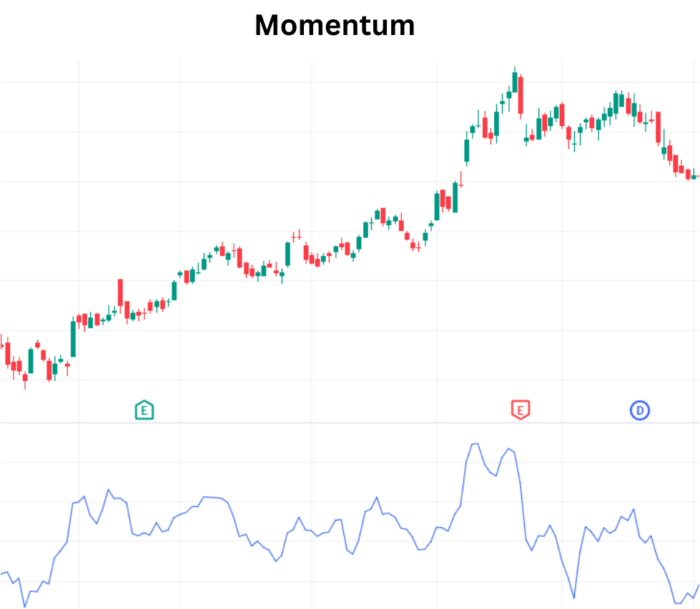
The Momentum Indicator
In the ever-evolving landscape of technical analysis, traders harness various technical indicator to decode market trends and make informed decisions. Among these tools, the Momentum Indicator stands out, offering insights into the relative positioning of current and past prices. This article delves into the Momentum Indicator’s calculation, its interpretation, and strategies to leverage its signals.
Understanding Momentum Calculation:
The Momentum Indicator assesses the current price’s relationship with its past values, allowing traders to gauge the strength and direction of market trends. The calculation is straightforward: subtract the price n-periods ago from the current price. The chosen number of periods (n) is at the trader’s discretion, reflecting their analytical preferences.
Interpretations of Momentum Indicator Signals:
- Zero-Line Crossover:
- When Momentum (MOM) crosses the 0 value on the way up, it signals a potential buying opportunity, and the corresponding value is assigned as “Buy.”
- Conversely, when MOM crosses the 0 value on the way down, it suggests a potential selling opportunity, and the corresponding value is assigned as “Sell.”
- If MOM does not cross the 0 value, the corresponding value is assigned as “Hold,” indicating a period without a clear directional bias.
- Divergence Analysis:
- Bullish Divergence: Occurs when prices make a lower low, but MOM forms a higher low. This indicates reduced downward momentum and signals a potential buying opportunity.
- Bearish Divergence: Forms when prices make a higher high, but MOM forms a lower high. This suggests waning upward momentum and signals a potential selling opportunity.
- If neither bullish nor bearish divergence is present, the corresponding value is assigned as “Hold.”
Incorporating Momentum Strategies:
- Zero-Line Confirmation: Use zero-line crossovers to confirm the strength and direction of market trends.
- Divergence as Reversal Signals: Leverage divergence signals to anticipate potential trend reversals.
- Combining with Other Indicators: Enhance the robustness of your strategy by integrating Momentum signals with complementary technical indicators.
Conclusion:
The Momentum Indicator, with its emphasis on current vs. past price differentials, offers traders valuable insights into market dynamics. Whether signaling zero-line crossovers or highlighting divergence patterns, Momentum strategies empower traders to navigate the waves of market trends. As you explore technical analysis tools, consider incorporating Momentum to elevate your ability to make well-informed trading decisions.
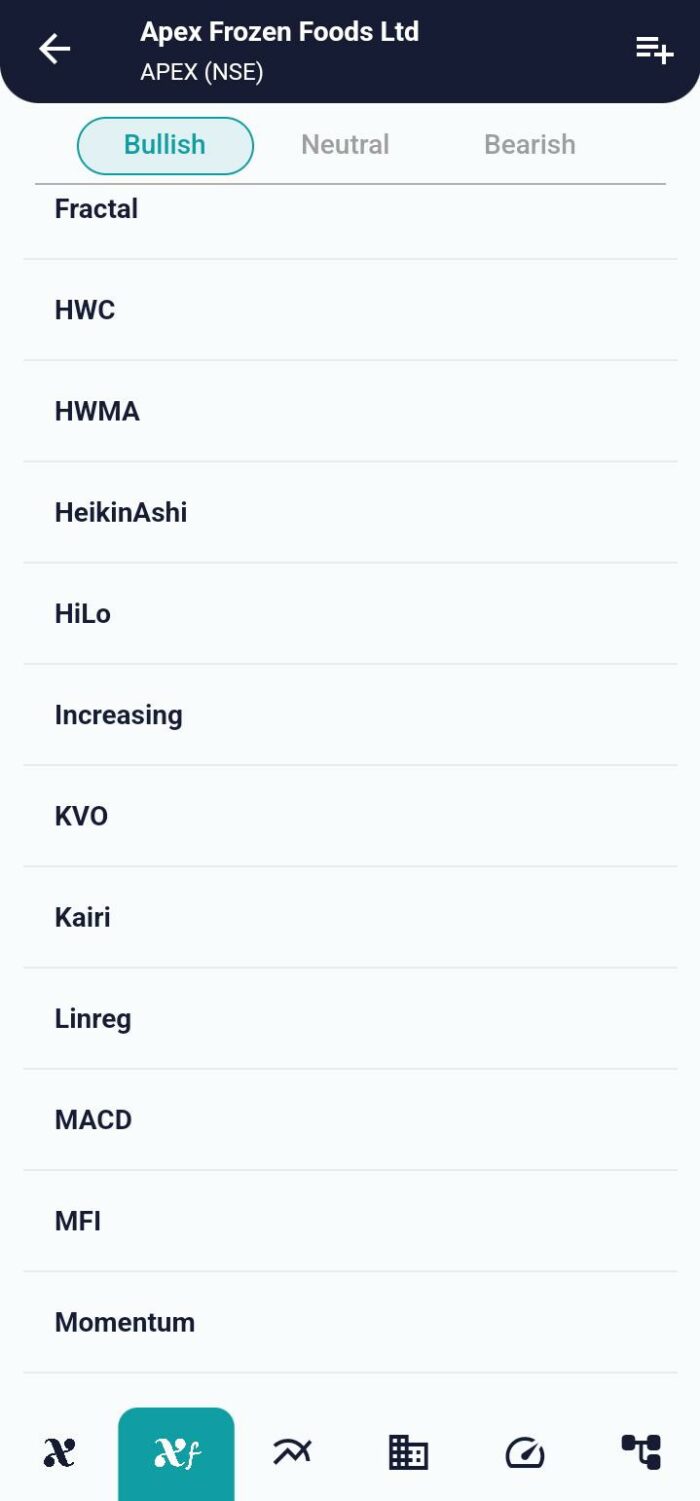
xCalData is an exceptional app available for Android devices that offers unbiased insights into stocks, allowing investors to make informed decisions. With its user-friendly interface and comprehensive features, xCalData provides a valuable resource for anyone interested in the stock market. Download the app from google play.
For Actionable Intelligence, subscribe to xCalData app on Android devices: https://tinyurl.com/downloadxCalData
Popular Posts
-
Stock of Interest . August 23, 2024
#HSCL (NSE) Stock Report | 23 Aug 2024
-
Stock of Interest . August 23, 2024
Add Zerodha trading account to xCalData
-
Stock of Interest . August 23, 2024
What is xCalData , how to use it and how accurate is it?
-
Stock of Interest . August 23, 2024
Jurik Moving Average (JMA): A Profit Trading Insight