Strategy
Posted On: December 11, 2025
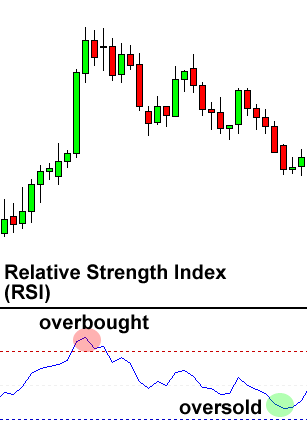
RSI strategy: The Smart Way to Predict Market Turns
The Relative Strength Index (RSI) is one of the most popular momentum indicators used in technical analysis. Developed by J. Welles Wilder, RSI helps traders identify overbought and oversold conditions in the market. The RSI trading strategy is widely used because it provides clear, simple, and reliable signals that help traders time entries and exits more effectively. Whether you’re a beginner or an experienced trader, understanding RSI can significantly improve your market decisions.
How RSI Works
Overbought Zone (RSI above 70)
When RSI crosses above 70, it indicates that the asset may be overbought and due for a correction or reversal. This can signal:
A profit-booking zone
A potential sell or short opportunity
Oversold Zone (RSI below 30)
When RSI drops below 30, it shows the asset is oversold and may bounce back upward. This can signal:
A potential buying opportunity
A trend reversal from bearish to bullish
Midline (50 Level)
The 50 line acts as a trend strength indicator:
RSI above 50 → bullish momentum
RSI below 50 → bearish momentum
Importance of RSI strategy
Helps Identify Trend Reversals
RSI highlights overbought/oversold conditions, helping traders anticipate turning points before they occur.
Improves Timing for Buy and Sell Decisions
Instead of randomly entering trades, RSI gives clear zones for high-probability entries.
Filters Out Market Noise
RSI smooths out volatility and provides a clean momentum reading, especially in choppy markets.
Works Across All Time Frames
Whether you trade intraday, swing, or positional, RSI adapts to all timeframes.
Conclusion
The RSI trading strategy is a simple yet powerful method for identifying market strength, trend changes, and entry/exit points. By analyzing overbought and oversold zones, midline signals, and divergences, traders gain a clear understanding of market momentum. RSI is valuable for beginners and experts alike because of its accuracy and versatility.
Using RSI alongside other technical tools can significantly enhance your trading confidence and improve overall performance.
Where can I see further insights on this stock?
xCalData offers unbiased insights into stocks. Download the app from google play. For Actionable Intelligence, subscribe to xCalData app on Android devices: Download here
For Actionable Intelligence, subscribe to xCalData app on Android devices: https://tinyurl.com/downloadxCalData

Popular Posts
-
Stock of Interest . August 23, 2024
#HSCL (NSE) Stock Report | 23 Aug 2024
-
Stock of Interest . August 23, 2024
Add Zerodha trading account to xCalData
-
Stock of Interest . August 23, 2024
What is xCalData , how to use it and how accurate is it?
-
Stock of Interest . August 23, 2024
Jurik Moving Average (JMA): A Profit Trading Insight