Technical Indicator
Posted On: February 8, 2024
RSX Indicator : An investment in knowledge
Introduction:
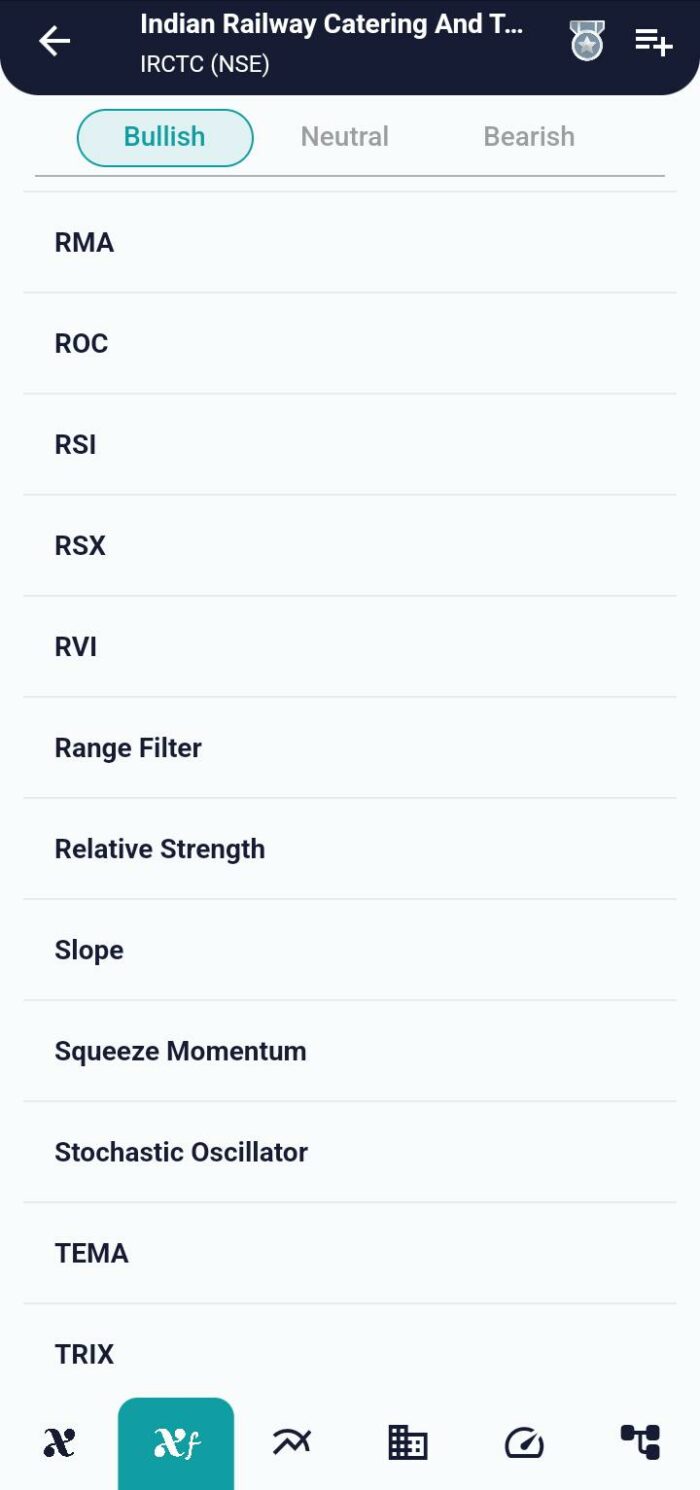
The RSX Indicator(Relative Strength Index Smoothed ) Relative Strength Xtra technical indicator represents a significant advancement in the realm of technical analysis, particularly as an enhanced version of the traditional Relative Strength Index (RSI). Tailored to identify market dynamics and price patterns with increased precision, the RSX offers traders a valuable tool for deciphering market conditions and making informed trading decisions. This comprehensive guide delves into the intricacies of the RSX indicator, exploring its features, interpretation, and practical applications across various trading styles. In this blog we share about this indicator by using our xCalData app.
Understanding the RSX Indicator:
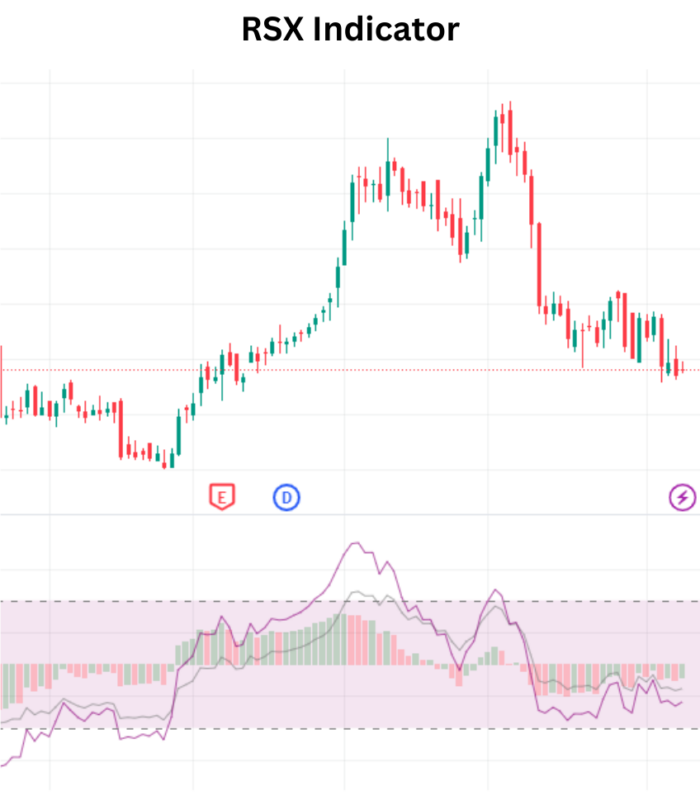
The RSX indicator is designed to enhance the accuracy of signals by eliminating market noise and providing smoother indications of overbought and oversold conditions. Displayed as a separate window beneath the main price chart, the RSX is instrumental in capturing market dynamics and assisting traders in identifying potential buying or selling opportunities. With values ranging from 0 to 100, the RSX indicator categorizes market sentiment into distinct zones, aiding traders in assessing the strength and potential direction of the prevailing trend.
Calculation of RSX Value:
The RSX value is calculated based on historical market data, incorporating advanced smoothing techniques to reduce noise and enhance signal accuracy. The resulting value, ranging from 0 to 100, serves as a quantitative representation of the current market conditions, with higher values indicating bullish sentiment and lower values reflecting bearish sentiment.
Interpreting RSX Indicator Values:
- Strong Bullish (RSX > 70):
- RSX values exceeding 70 suggest a strong bullish sentiment in the market.
- Traders may interpret this as a potential indication of an overextended bullish trend.
- Bullish (50 < RSX ≤ 70):
- RSX values between 50 and 70 signify a bullish market sentiment.
- Traders may view this as a positive but not excessively overbought condition.
- Bearish (30 < RSX ≤ 50):
- RSX values between 30 and 50 indicate a bearish market sentiment.
- Traders may interpret this as a potential indication of an oversold condition.
- Strong Bearish (RSX ≤ 30):
- RSX values equal to or less than 30 suggest a strong bearish sentiment in the market.
- Traders may view this as a potential indication of an overextended bearish trend.
- Neutral (No Conditions Met):
- If RSX values do not fall into any of the above conditions, the market sentiment is considered neutral.
- Traders may exercise caution and await clearer signals before making trading decisions.
Practical Applications of RSX Indicator:
- Day Trading:
- Utilize RSX signals to identify intraday trends and potential reversal points.
- Scalping:
- Leverage the smoothed signals of RSX for quick and precise entry and exit decisions.
- Swing Trading:
- Incorporate RSX values to assess the strength of the prevailing trend and identify optimal swing trading opportunities.
- Divergence Analysis:
- Explore divergence between price movements and RSX values for potential trend reversal signals.
- Risk Management:
- Implement effective risk management strategies based on RSX signals to protect capital.
Conclusion:
The RSX indicator, with its advanced smoothing techniques and precise signals, stands as a valuable asset for traders across different styles and preferences. By offering a nuanced interpretation of market sentiment and potential trend conditions, the RSX empowers traders to make informed decisions and navigate the complexities of financial markets. As with any technical indicator, traders are encouraged to combine RSX signals with other analytical tools and exercise prudent risk management for a holistic and effective trading approach.
xCalData is an exceptional app available for Android devices that offers unbiased insights into stocks, allowing investors to make informed decisions. With its user-friendly interface and comprehensive features, xCalData provides a valuable resource for anyone interested in the stock market. Download the app from google play.
For Actionable Intelligence, subscribe to xCalData app on Android devices: https://tinyurl.com/downloadxCalData
Popular Posts
-
Stock of Interest . August 23, 2024
#HSCL (NSE) Stock Report | 23 Aug 2024
-
Stock of Interest . August 23, 2024
Add Zerodha trading account to xCalData
-
Stock of Interest . August 23, 2024
What is xCalData , how to use it and how accurate is it?
-
Stock of Interest . August 23, 2024
Jurik Moving Average (JMA): A Profit Trading Insight