General
Posted On: October 30, 2023
Simplify Investment Analysis with xCalData’s Financial Ratios
Investors, both seasoned and novice, know that analyzing a company’s financial health is a pivotal step in making sound investment decisions. This process traditionally involves diving deep into financial statements and meticulously calculating various ratios. However, xCalData is revolutionizing this process by offering a one-stop solution for comprehensive financial ratios. Our platform provides an extensive range of essential ratios, including Return on Equity (ROE), Return on Assets (ROA), Debt to Equity, Debt to Assets, Asset Turnover Ratio, Net Income, Total Revenue, Tax Provision, and many more. In this blog, we’ll explore how xCalData’s diverse financial ratios empower investors to make informed choices and navigate the complex landscape of financial analysis.
The Power of Financial Ratios
Financial ratios are the backbone of investment analysis. They offer a clear and concise way to assess a company’s financial stability, profitability, and operational efficiency. However, the challenge lies in gathering and interpreting this data. This is where xCalData steps in to simplify your investment journey.
Introducing xCalData
xCalData is a revolutionary platform designed to provide investors, analysts, and professionals with quick and easy access to a vast array of financial ratios. Our platform gathers data from diverse sources, processes it, and presents it in a user-friendly format, enabling you to make data-driven decisions with confidence. Here’s how xCalData can simplify your investment analysis:
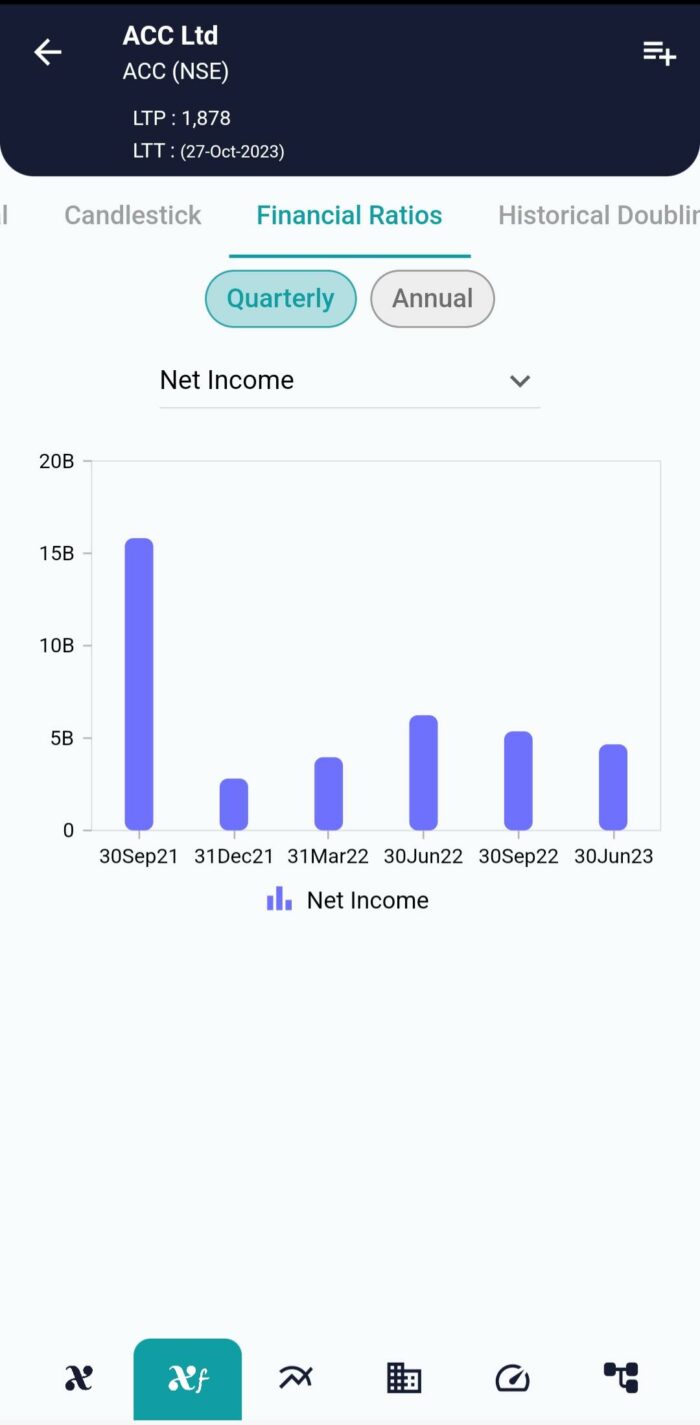
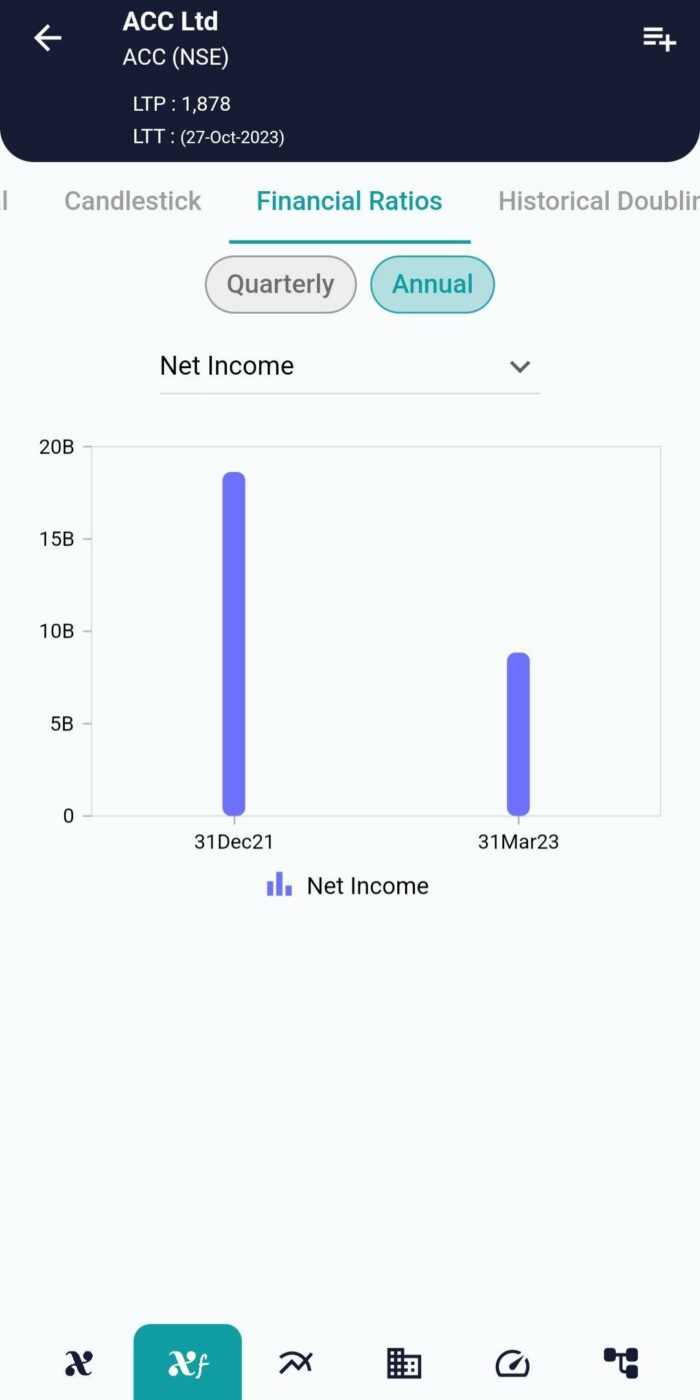
To See Financial Ratios of the Stock,
- Open xCalData
- Search the Stock you want to see in the search bar(Search Stocks),
- Click to Open the Stock
- Select Xf (X Factor) in the bottom tabs
- Select Financial Ratios
A Treasure Trove of Financial Ratios:
At xCalData, we understand that investors need a multitude of financial ratios to assess a company’s financial performance from various angles. Our platform offers an extensive library of ratios, each serving a unique purpose in investment analysis. Here’s a glimpse of the financial ratios available:
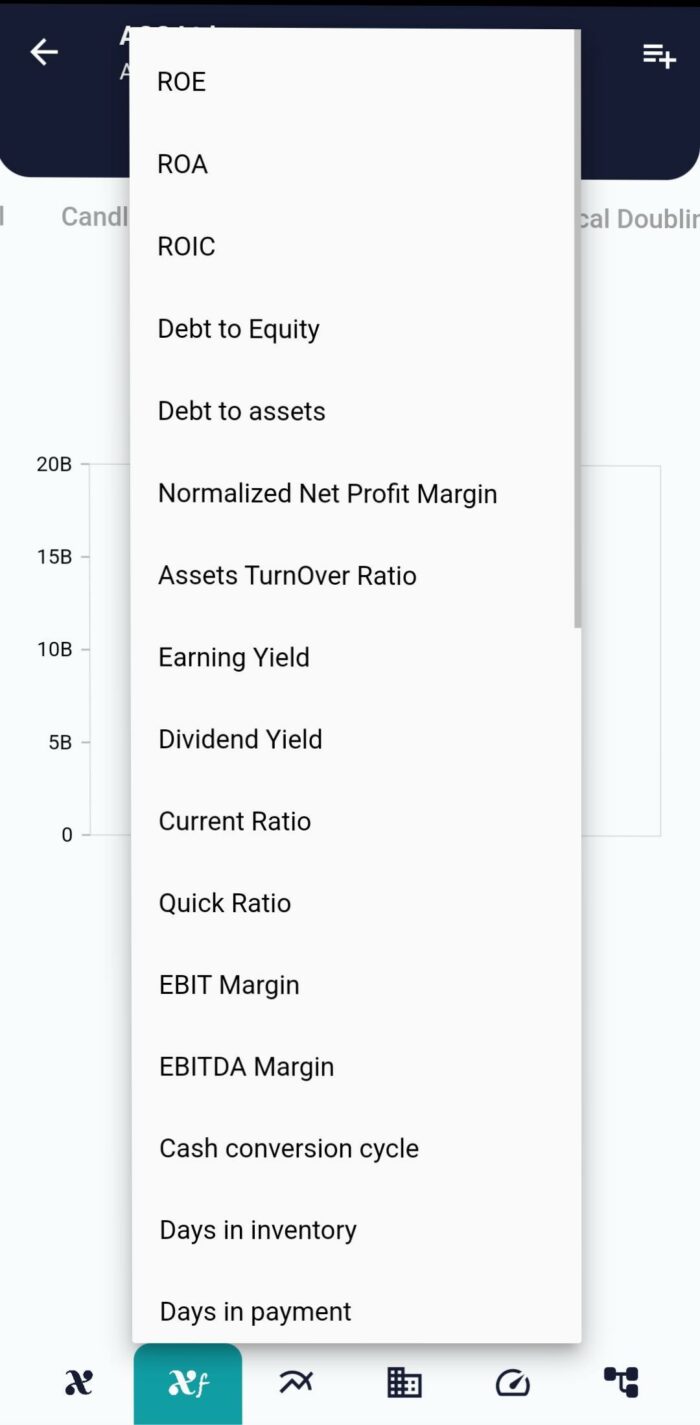
- ROE (Return on Equity): Assess a company’s profitability by measuring how efficiently it uses shareholders’ equity to generate profits.
- ROA (Return on Assets): Evaluate a company’s ability to generate earnings from its total assets, helping you gauge operational efficiency.
- Debt to Equity Ratio: Understand a company’s leverage and financial risk by comparing its total debt to shareholders’ equity.
- Debt to Assets Ratio: Determine the extent to which a company’s assets are financed through debt, shedding light on its financial stability.
- Asset Turnover Ratio: Measure how effectively a company utilizes its assets to generate revenue, providing insights into operational efficiency.
- Net Income: Analyze a company’s bottom-line profitability by examining its total earnings after expenses.
- Total Revenue: Understand the company’s top-line performance by assessing its total sales and revenue.
- Tax Provision: Gain insights into the company’s tax obligations, which can significantly impact its financial health.
Streamlining Investment Analysis
The xCalData platform simplifies investment analysis in several ways:
- Efficiency: With access to an extensive library of financial ratios, investors can efficiently assess a company’s financial health without extensive research.
- Customization: Customize your analysis to align with your unique investment strategy. Create portfolios, set alerts, and generate reports tailored to your needs.
- Real-Time Data: Stay up-to-date with real-time financial data, ensuring you have the latest information to base your investment decisions on.
- Risk Management: Mitigate risks effectively by using a wide range of financial ratios to assess a company’s financial stability and operational efficiency.
Conclusion:
Investing in the stock market can be a complex journey, but xCalData is here to simplify it. Our platform offers a vast array of financial ratios, including ROE, ROA, Debt to Equity, Debt to Assets, Asset Turnover Ratio, Net Income, Total Revenue, Tax Provision, and many more. By having access to this comprehensive set of ratios, investors can make data-driven investment decisions with confidence, effectively manage risks, and potentially enhance their investment returns. Simplify your investment analysis and embark on your investment journey with xCalData today!
Popular Posts
-
Stock of Interest . August 23, 2024
#HSCL (NSE) Stock Report | 23 Aug 2024
-
Stock of Interest . August 23, 2024
Add Zerodha trading account to xCalData
-
Stock of Interest . August 23, 2024
What is xCalData , how to use it and how accurate is it?
-
Stock of Interest . August 23, 2024
Jurik Moving Average (JMA): A Profit Trading Insight