Technical Indicator
Posted On: February 8, 2024
Smart Trading Success with SMI Ergodic
Introduction:
The SMI Ergodic technical indicator emerges as a formidable ally, offering a comprehensive perspective by blending long-term and short-term components. In the dynamic landscape of financial markets, traders seek robust tools that provide nuanced insights into market trends and momentum. This article delves into the intricacies of the SMI Ergodic Indicator, unraveling its unique features, interpretation, and its role in empowering traders to make well-informed decisions by using xCaldata app.
Understanding the SMI Ergodic Indicator:
The SMI Ergodic Indicator is a potent technical analysis tool designed to decipher market trends and momentum. By amalgamating both long-term and short-term components, this indicator furnishes traders with a holistic view of market conditions. The term “ergodic” implies stability and reliability, highlighting the indicator’s capacity to capture significant price movements while minimizing noise in the data. Whether you’re a seasoned trader or a novice, the SMI ergodic Indicator stands out as a valuable asset in refining trading strategies.
Mathematical formula:
SMI ergodic = TSI (Close) N periods

Where, TSI = true strength index
The formula for TSI: TSI = (PCDS/APCDS) x 100
The formula for calculating the TSI involves the following steps.
PC = CCP − PCP
PCS = 25-period EMA of PC
PCDS = 13-period EMA of PCS
APC = AVCCP − PCP
APCS = 25-period EMA of APC
APCDS = 13-period EMA of APCS
where:
PCDS = PC double smoothed
APCDS = Absolute PC double smoothed
PC = Price change
CCP = Current close price
PCP = Prior close price
PCS = PC smoothed
EMA = Exponential moving average
APC = Absolute PC
APCS = Absolute PC smoothed
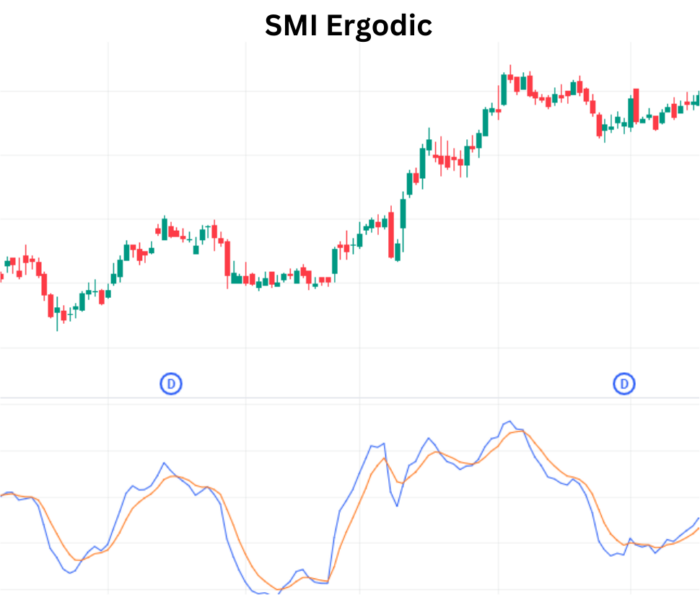
Key Components of the SMI Ergodic Indicator:
- SMI (Stochastic Momentum Index):
- Reflects short-term market momentum.
- Oscillates around the zero line, providing insights into overbought and oversold conditions.
- SMI Signal Line:
- Represents the longer-term market momentum.
- Smooths out fluctuations, offering a clearer trend perspective.
Interpreting SMI Ergodic Indicator Signals:
- Bullish Signal (Buy):
- Condition: SMI and SMI Signal values are below zero and converge.
- Interpretation: Indicates a potential buy signal. The convergence below zero suggests favorable conditions for entering or reinforcing long positions.
- Bearish Signal (Sell):
- Condition: SMI and SMI Signal values are above zero and converge.
- Interpretation: Triggers a sell signal. The convergence above zero implies a potential downturn, prompting traders to consider short positions or exit long positions.
Practical Application of the SMI Ergodic Indicator:
- Trend Identification:
- Utilize the SMI Indicator to identify the prevailing market trend, distinguishing between bullish and bearish phases.
- Confirmation with Other Indicators:
- Combine the SMI Ergodic Indicator with other technical indicators to validate trend signals and enhance overall analysis.
- Divergence Analysis:
- Conduct divergence analysis by comparing price movements with SMI Indicator signals, identifying potential trend reversals.
- Risk Management:
- Integrate the indicator into risk management strategies, leveraging its insights to set appropriate stop-loss and take-profit levels.
- Adaptability Across Timeframes:
- Apply the SMI Ergodic Indicator across various timeframes, adapting its use to different trading styles and market conditions.
Conclusion:
The SMI Ergodic Indicator stands as a stalwart companion for traders navigating the complexities of financial markets. Its unique combination of short-term and long-term components offers a nuanced understanding of market trends and momentum. The convergence and divergence signals serve as invaluable cues for making timely and well-informed trading decisions. Whether employed by day traders, swing traders, or investors, the SMI Ergodic Indicator’s versatility and reliability make it an indispensable tool for maximizing profitability and refining trading strategies in diverse market scenarios.
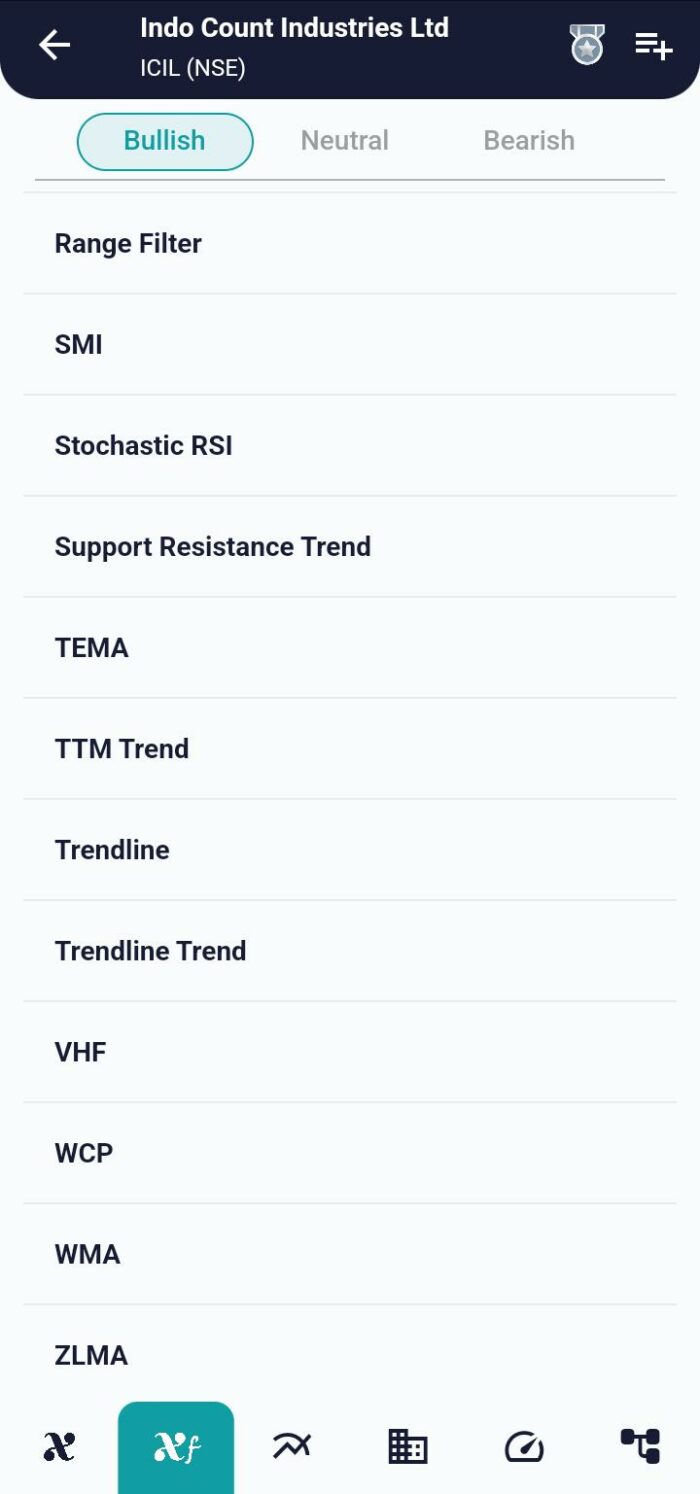
xCalData is an exceptional app available for Android devices that offers unbiased insights into stocks, allowing investors to make informed decisions. With its user-friendly interface and comprehensive features, xCalData provides a valuable resource for anyone interested in the stock market. Download the app from google play.
For Actionable Intelligence, subscribe to xCalData app on Android devices: https://tinyurl.com/downloadxCalData
Popular Posts
-
Stock of Interest . August 23, 2024
#HSCL (NSE) Stock Report | 23 Aug 2024
-
Stock of Interest . August 23, 2024
Add Zerodha trading account to xCalData
-
Stock of Interest . August 23, 2024
What is xCalData , how to use it and how accurate is it?
-
Stock of Interest . August 23, 2024
Jurik Moving Average (JMA): A Profit Trading Insight