Technical Indicator
Posted On: February 5, 2024
Smart Trading with Ichimoku
Unraveling the Mysteries of Ichimoku
1. Introduction to Ichimoku Kinko Hyo:
- Ichimoku Kinko Hyo, or Ichimoku, stands as a multifaceted technical indicator delving into momentum, support, and resistance.
- Japanese journalist Goichi Hosoda created this technical indicator, which was first released in the late 1960s.
- In comparison to a regular candlestick chart, it offers more data points. Even though it looks difficult at first, people who know how to read charts can typically understand it easily because of the clearly stated trade indications.
2. Components of Ichimoku:
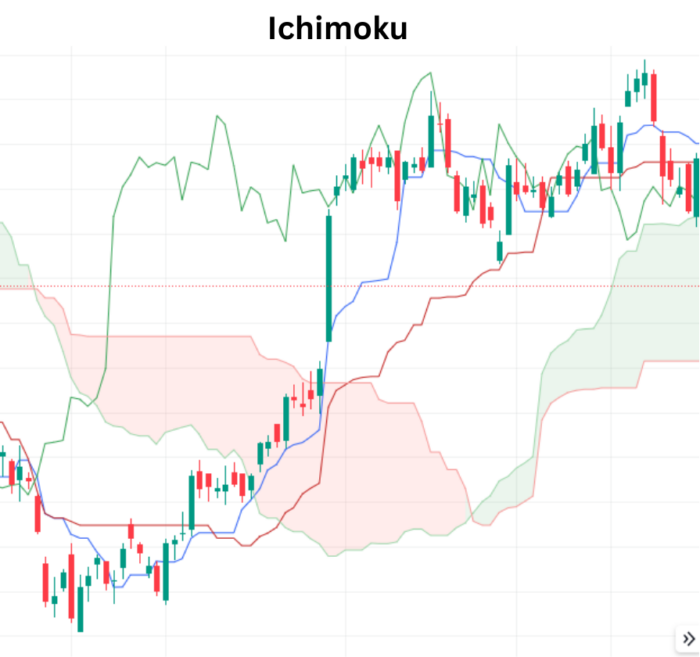
- Tenkan-sen: Often referred to as the conversion line, it reflects short-term momentum.
- Kijun-sen: Known as the base line, it gauges medium-term momentum.
- Senkou Span A and B: These form the cloud, providing insights into future support and resistance levels.
- Chikou Span: The lagging line, indicating the current price relative to historical prices.

The Formulas for the Ichimoku
The following are the five formulas for the lines that comprise this indicator Cloud indicator.2
Conversion Line (tenkan sen)=9-PH+9-PL2
Base Line (kijun sen)=26-PH + 26-PL2
Leading Span A (senkou span A)=CL + Base Line2
Leading Span B (senkou span B)=52-PH + 52-PL2
Lagging Span (chikou span)=Close plotted 26 periods in the past
where:
PH=Period high
PL=Period low
CL=Conversion line
Deciphering Ichimoku Signals
1. Bullish Signal:
- Crossover of Tenkan and Kijun:
- When Tenkan crosses above Kijun, it’s a compelling buy signal.
- Cloud Considerations:
- Prices above the cloud signal bullish momentum.
- Chikou Span above the cloud reinforces bullish sentiment.
2. Bearish Signal:
- Crossover of Kijun and Tenkan:
- Kijun crossing above Tenkan signifies a potential sell signal.
- Cloud Dynamics:
- Prices below the cloud indicate bearish pressure.
- Chikou Span below the cloud accentuates bearish sentiment.
Ichimoku in Action: Practical Insights
1. Identifying Trends:
- Uptrend:
- Tenkan consistently above Kijun.
- Prices above the cloud.
- Chikou Span above historical prices.
2. Spotting Reversals:
- Bullish Reversal:
- Tenkan crosses above Kijun.
- Prices move above the cloud.
- Chikou Span confirms with an upward trajectory.
- Bearish Reversal:
- Kijun crosses above Tenkan.
- Prices dip below the cloud.
- Chikou Span echoes a downward shift.
3. Navigating Complex Signals:
- Cloud Twists:
- A twist in the cloud could indicate shifting dynamics.
- Crossings within the cloud may suggest indecision.

Strategies Using Ichimoku:
This strategy adeptly combines trend identification through this indicator and momentum analysis using the Awesome Oscillator. While showcasing effectiveness, it’s crucial to acknowledge the inherent risks, prompting traders to exercise caution and take calculated risks. This blog post aims to unravel the intricacies of the Awesome Oscillator & Ichimoku Strategy, and Heikin Ashi & Ichimoku exploring its indicators, datasets, parameters, and buy/sell conditions using XCaldata app.
Conclusion: Mastering Ichimoku Dynamics
As you embark on your journey with Ichimoku Kinko Hyo, the convergence of its components provides a holistic view of market trends. Whether you’re navigating bullish waves or identifying potential reversals, the signals derived from Tenkan, Kijun, the cloud, and Chikou Span offer a nuanced understanding of market dynamics. Remember, practice and real-time observation are essential to mastering the art of analysis. May your journey be filled with clarity and successful trades!
xCalData is an exceptional app available for Android devices that offers unbiased insights into stocks, allowing investors to make informed decisions. With its user-friendly interface and comprehensive features, xCalData provides a valuable resource for anyone interested in the stock market. Download the app from google play.
For Actionable Intelligence, subscribe to xCalData app on Android devices: https://tinyurl.com/downloadxCalData
Popular Posts
-
Stock of Interest . August 23, 2024
#HSCL (NSE) Stock Report | 23 Aug 2024
-
Stock of Interest . August 23, 2024
Add Zerodha trading account to xCalData
-
Stock of Interest . August 23, 2024
What is xCalData , how to use it and how accurate is it?
-
Stock of Interest . August 23, 2024
Jurik Moving Average (JMA): A Profit Trading Insight