Candlestick Pattern
Posted On: February 12, 2024
Spinning Top Pattern: Navigating Market Indecision in Trading
Spinning Top pattern:
In the dynamic realm of financial markets, traders harness a myriad of technical analysis tools to navigate the complexities of trend reversals and market dynamics. Candlestick patterns, renowned for their ability to provide actionable insights, are indispensable in this pursuit. The Spinning Top candlestick pattern is one such formation that merits attention from traders, acting as a signal for potential market indecision. In this blog post, we will explore the concept of the Spinning Top pattern, delve into its identification process, and discuss how traders can interpret this pattern to augment their trading strategies.
The Spinning Top pattern is a single-candlestick formation that frequently appears during periods of market uncertainty or indecision. It signifies a tug of war between buyers and sellers, with neither party establishing dominance. The candlestick features a small body, where the opening and closing prices are close to each other, and long upper and lower wicks, indicating significant price fluctuations within the trading period.
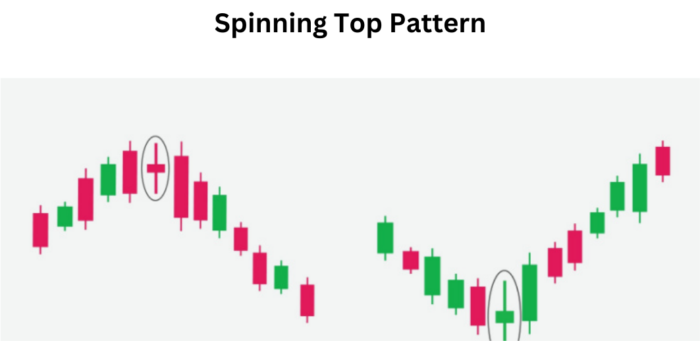
Identifying the Spinning Top Pattern:
To identify the Spinning Top pattern, traders should scrutinize the following key characteristics:
- Market Indecision: The Spinning Top materializes when there is uncertainty in the market, and neither buyers nor sellers have a clear advantage.
- Small Body: The candlestick has a small body, suggesting that the opening and closing prices are in proximity, reflecting indecision among market participants.
- Long Upper and Lower Wicks: The presence of extended upper and lower wicks indicates that there were substantial price movements during the trading period.
Interpreting the Spinning Top Pattern:
The Spinning Top pattern conveys a sense of market indecision, with neither bulls nor bears able to establish control. Traders interpret this pattern as a warning sign, signaling potential changes in market sentiment. The Spinning Top does not provide a clear direction, but it suggests that the prevailing trend may be losing momentum, and a reversal or continuation is possible.
Considerations for Traders:
- Confirmation Signals: While the Spinning Top pattern offers insights into market indecision, traders often seek confirmation from other technical indicators or patterns before making trading decisions.
- Volume Analysis: Examining trading volume during the formation of the Spinning Top can provide additional clues. An increase in volume may signify increased interest and potential for a significant price move.
- Trend Analysis: Considering the context of the pattern within the overall trend is crucial. In an uptrend, a Spinning Top may signal a potential reversal, while in a downtrend, it may indicate a possible change in momentum.
- Combining with Other Patterns: Integrating the Spinning Top pattern with other candlestick patterns or technical indicators can enhance the robustness of trading decisions.
Conclusion:
The Spinning Top candlestick pattern serves as a valuable tool for traders navigating uncertain market conditions. By understanding its characteristics and implications, traders can adapt their strategies to capitalize on potential changes in market sentiment. However, prudent trading involves comprehensive analysis and confirmation from multiple sources to mitigate risks associated with market uncertainty.
Trading always involves risk, and it is crucial to develop a well-rounded trading strategy, including risk management techniques, to increase your productivity and achieve long-term success in the financial markets, Visit and download xCalData.
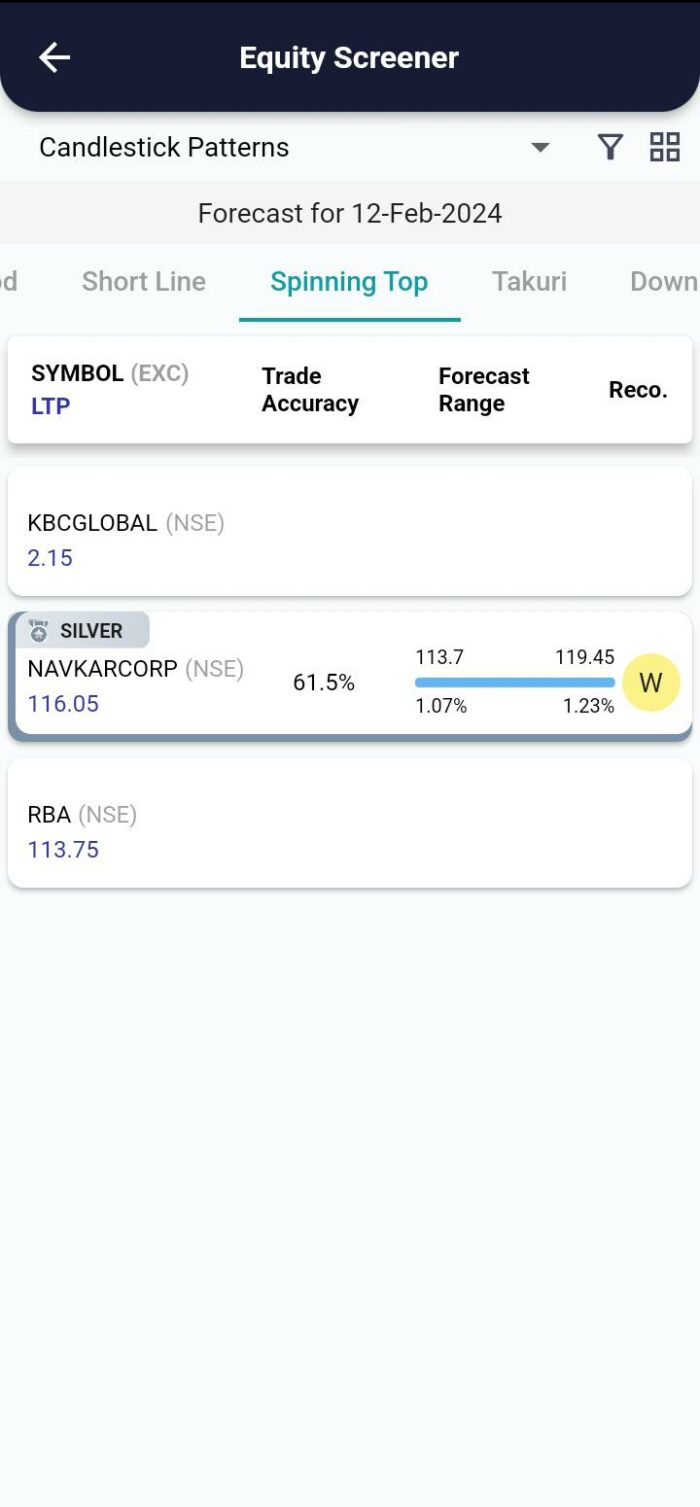
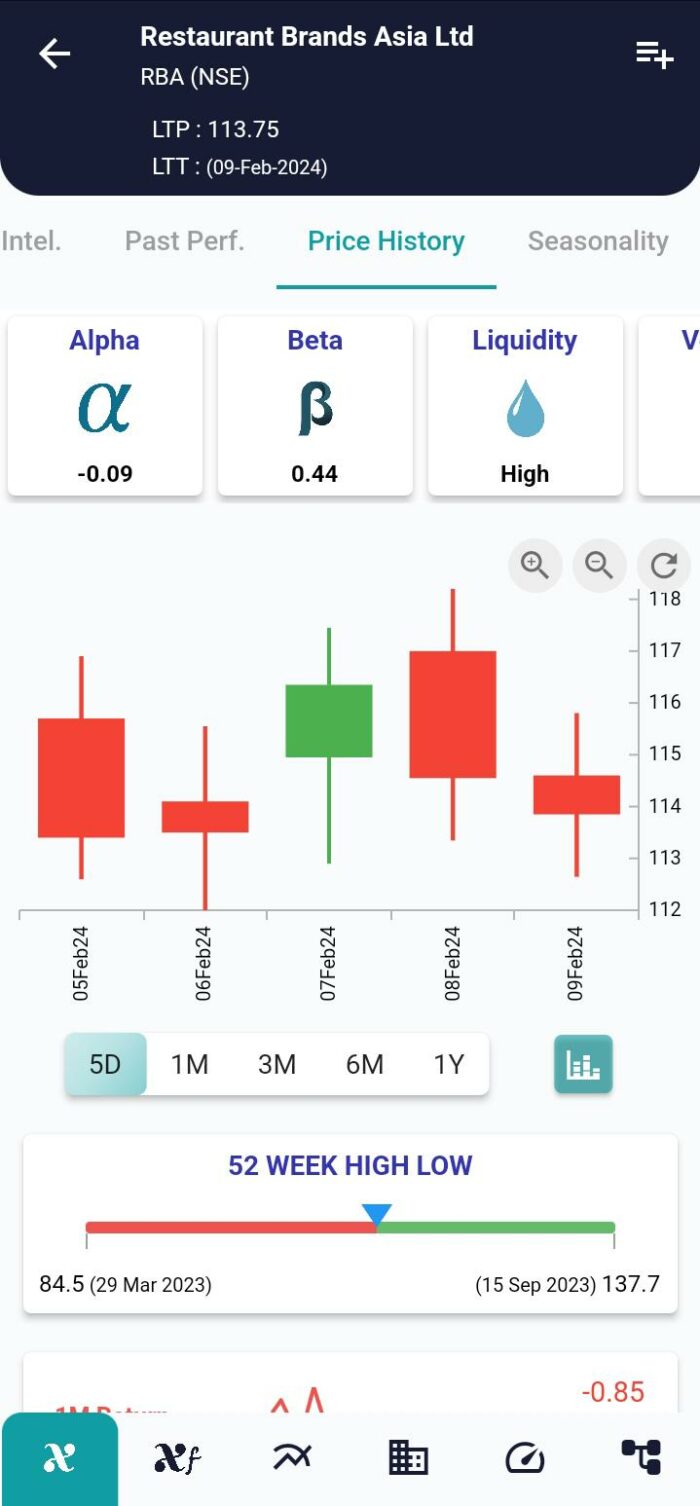
Where can I see further insights on this stock?
xCalData offers unbiased insights into stocks. Download the app from google play. For Actionable Intelligence, subscribe to xCalData app on Android devices: Download here
For Actionable Intelligence, subscribe to xCalData app on Android devices: https://tinyurl.com/downloadxCalData

Disclaimer: The securities quoted are for illustration only and are not recommendatory.
Popular Posts
-
Stock of Interest . August 23, 2024
#HSCL (NSE) Stock Report | 23 Aug 2024
-
Stock of Interest . August 23, 2024
Add Zerodha trading account to xCalData
-
Stock of Interest . August 23, 2024
What is xCalData , how to use it and how accurate is it?
-
Stock of Interest . August 23, 2024
Jurik Moving Average (JMA): A Profit Trading Insight