Technical Indicator
Posted On: February 8, 2024
Squeeze Indicator Famous For Trading
Introduction:
In the ever-evolving landscape of financial markets, traders strive to identify opportune moments for potential price explosions. The squeeze technical indicator , a dynamic fusion of Bollinger Bands and Keltner Channels, emerges as a powerful tool for recognizing periods of low volatility, often preceding significant price movements. This article unveils the intricacies of the squeeze indicator, elucidating its components, interpretation, and the nuanced signals it provides to traders seeking to navigate volatile market conditions.
Understanding the Squeeze Indicator:
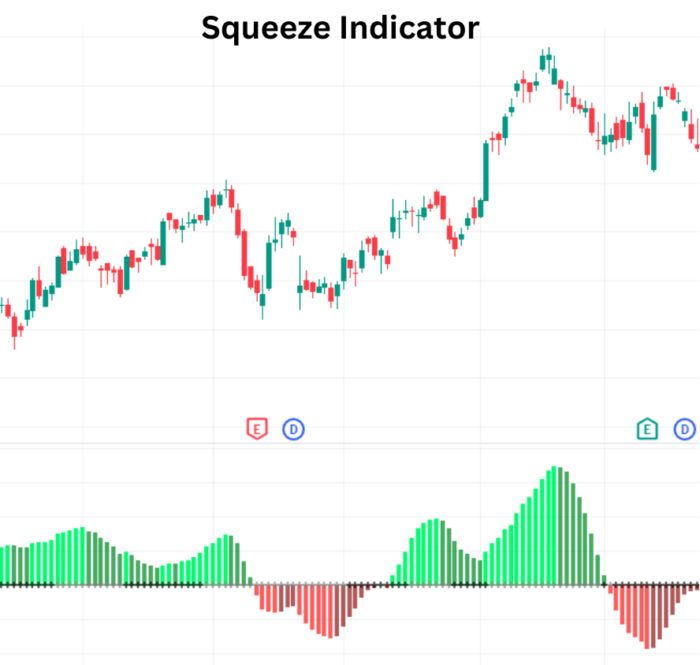
The squeeze indicator operates on a fundamental premise: periods of low volatility are typically succeeded by heightened volatility, indicating potential substantial price shifts. Comprising Bollinger Bands, Keltner Channels, and the squeeze line, this indicator plays a pivotal role in identifying moments of market indecision before significant breakouts occur.
Mathematical Formula:
Squeeze = SMA (Close Price) of N Periods
Squeeze on = bbands (Lower)>kc (Lower) & bbands (Upper)<kc (Upper)
Squeeze Off = bbands (Lower)<kc (Lower) & bbands (Upper)>kc (Upper)
Squeeze no = Neither Squeeze on Nor Squeeze Off.
Squeeze_LZ = Lin reg (Close price – AVG (highest high + lowest low) * SMA of Close price
Similarly, the squeeze on, off, no values.
Squeeze Pro = Squeeze _LZ
Here, find Squeeze wide, narrow, normal Upper and Lower values for diff scalar values.
Where,
SMA= Simple Moving Average
N=20
Bbands = Bollinger Bands Indicator
Bbands lower =SMA of Close Price – std * 20 period STD of Close Price
Bbands Upper = SMA of Close Price + std * 20 period STD of Close Price
Kc=Keltner Channels indicator.
Kc lower = SMA of Close Price – kc scalar * max true range of high low close.
Kc upper = = SMA of Close Price + kc scalar * max true range of high low close.
Key Components of the Squeeze Indicator:
- Bollinger Bands:
- Provide insights into price volatility.
- Comprise an upper band, lower band, and a middle band (20-day simple moving average).
- Keltner Channels:
- Offer an additional layer of volatility assessment.
- Consist of an upper channel, lower channel, and a middle channel (20-day exponential moving average).
- Squeeze Line:
- Represents the convergence or divergence of Bollinger Bands and Keltner Channels.
- Crosses above the upper bands suggest potential upward breakouts, while crosses below the lower bands indicate potential downward breakouts.
Interpreting Squeeze Indicator Signals:
- Strongly Bullish Signal:
- Condition: Squeeze value is positive and increasing.
- Interpretation: Indicates a strongly bullish signal, signifying potential upward price movement. The increasing positive squeeze value suggests mounting potential energy for an explosive move.
- Strongly Bearish Signal:
- Condition: Squeeze value is negative and falling.
- Interpretation: Represents a strongly bearish signal, hinting at potential downward price movement. The decreasing negative squeeze value indicates building potential energy for a substantial move to the downside.
- Bullish Signal:
- Condition: Squeeze value is positive and falling.
- Interpretation: Suggests a bullish signal, indicating a potential upward move. The positive but decreasing squeeze value implies a less forceful but still favorable market condition.
- Bearish Signal:
- Condition: Squeeze value is negative and increasing.
- Interpretation: Indicates a bearish signal, pointing to potential downward movement. The negative and increasing squeeze value signals a market poised for a bearish breakout.
Practical Application of the Squeeze Indicator:
- Volatility Assessment:
- Use the squeeze indicator to assess periods of low volatility, anticipating potential high-volatility phases.
- Breakout Confirmation:
- Confirm potential breakouts by observing squeeze line crossovers above upper bands for bullish moves and below lower bands for bearish moves.
- Lazy Bear Adaptation:
- Employ Linear Regression to smooth values in Lazy Bear scenarios, enhancing signal clarity.
- Risk Management:
- Integrate the squeeze indicator into risk management strategies, adjusting position sizes based on anticipated volatility.
Conclusion:
The squeeze indicator stands as a beacon for traders navigating the dynamic waves of market volatility. Its amalgamation of Bollinger Bands, Keltner Channels, and the squeeze line provides a comprehensive view of potential breakout scenarios. Whether signaling strongly bullish, strongly bearish, bullish, or bearish conditions, the squeeze indicator equips traders with the insights needed to make timely and informed decisions. As an indispensable tool in the trader’s toolkit, the squeeze indicator unveils the potential energy within the market, allowing traders to position themselves strategically for impactful price movements.
xCalData is an exceptional app available for Android devices that offers unbiased insights into stocks, allowing investors to make informed decisions. With its user-friendly interface and comprehensive features, xCalData provides a valuable resource for anyone interested in the stock market. Download the app from google play.
For Actionable Intelligence, subscribe to xCalData app on Android devices: https://tinyurl.com/downloadxCalData
Popular Posts
-
Stock of Interest . August 23, 2024
#HSCL (NSE) Stock Report | 23 Aug 2024
-
Stock of Interest . August 23, 2024
Add Zerodha trading account to xCalData
-
Stock of Interest . August 23, 2024
What is xCalData , how to use it and how accurate is it?
-
Stock of Interest . August 23, 2024
Jurik Moving Average (JMA): A Profit Trading Insight