Technical Indicator
Posted On: February 8, 2024
Stochastic Oscillator : A Fabulous Indicator For Traders
Introduction:
The stochastic oscillator stands as a cornerstone of technical indicator analysis, providing traders with invaluable insights into market momentum and potential reversals. Developed in the 1950s, this oscillator has remained a popular tool for generating overbought and oversold signals. This guide delves into the intricacies of the stochastic oscillator, exploring its mechanics, interpretation, and practical applications in trading strategies.
Understanding the Stochastic Oscillator:
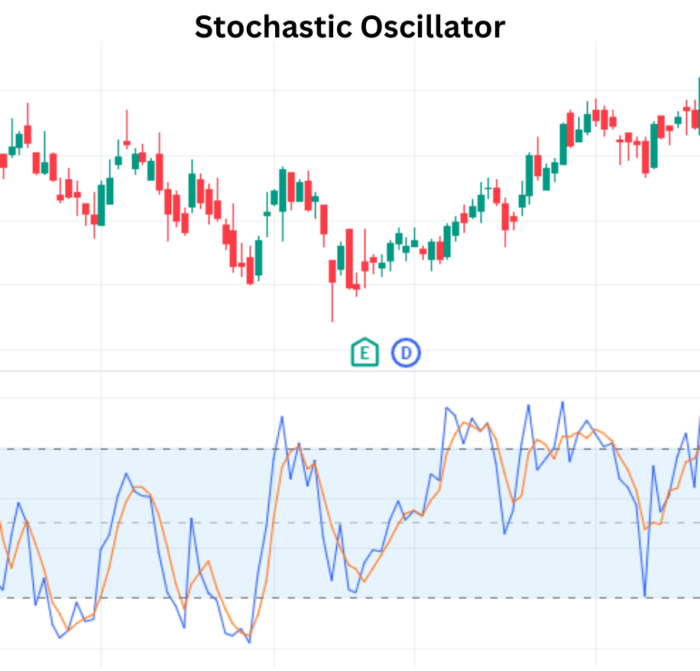
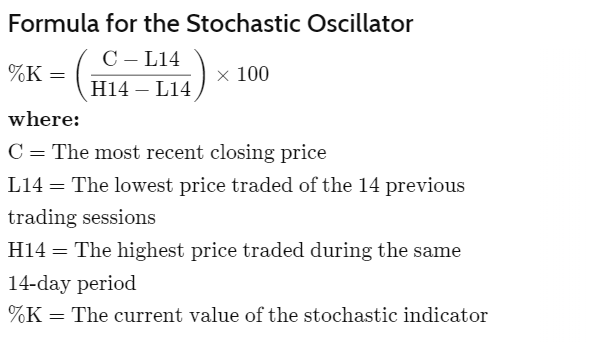
The stochastic oscillator compares a security’s closing price to its price range over a defined period, typically 14 periods. By quantifying the momentum of price changes, it oscillates within a range of 0 to 100, offering traders a gauge of overbought and oversold conditions.
Interpreting Stochastic Oscillator:
- Overbought and Oversold Levels:
- Traditionally, readings above 80 signal overbought conditions, while readings below 20 indicate oversold conditions.
- Strong trends can sustain these conditions, necessitating vigilance for potential trend shifts.
- Interpreting Signal Lines:
- Stochastic oscillator charting often includes two lines: the actual oscillator value and its three-day simple moving average.
- Intersection of these lines suggests potential trend reversals, signaling significant momentum shifts.
- Divergence Signals:
- Divergence between the stochastic oscillator and price action serves as a crucial reversal indicator.
- For instance, bullish divergence occurs when the oscillator prints a higher low amid a new lower low in price, hinting at a bullish reversal.
- %K and %D Components:
- %K, or the fast stochastic indicator, represents the actual oscillator value.
- %D, or the slow stochastic indicator, is a three-period moving average of %K, offering smoother signals.
Practical Application:
- Transaction Signals:
- Transaction signals are generated when %K crosses through %D, indicating potential buy or sell opportunities.
- This crossover strategy leverages momentum shifts to identify entry and exit points.
- Trend Analysis:
- Stochastic oscillator aids in trend analysis by assessing the velocity of price movements.
- Traders can use divergence signals and overbought/oversold conditions to confirm trend reversals or continuations.
- Customization and Optimization:
- Traders can adjust the stochastic oscillator parameters to suit their trading style and market conditions.
- Experimentation with different time periods and smoothing techniques can optimize signal accuracy.
Conclusion:
The stochastic oscillator stands as a versatile tool for traders seeking to navigate market momentum and identify potential trend reversals. By understanding its mechanics and interpreting its signals, traders can enhance their decision-making process and refine their trading strategies. Whether employed in conjunction with other technical indicators or as a standalone tool, the stochastic oscillator remains a cornerstone of technical analysis in the ever-evolving landscape of financial markets.
xCalData is an exceptional app available for Android devices that offers unbiased insights into stocks, allowing investors to make informed decisions. With its user-friendly interface and comprehensive features, xCalData provides a valuable resource for anyone interested in the stock market. Download the app from google play.
For Actionable Intelligence, subscribe to xCalData app on Android devices: https://tinyurl.com/downloadxCalData
Popular Posts
-
Stock of Interest . August 23, 2024
#HSCL (NSE) Stock Report | 23 Aug 2024
-
Stock of Interest . August 23, 2024
Add Zerodha trading account to xCalData
-
Stock of Interest . August 23, 2024
What is xCalData , how to use it and how accurate is it?
-
Stock of Interest . August 23, 2024
Jurik Moving Average (JMA): A Profit Trading Insight