Technical Indicator
Posted On: January 30, 2024
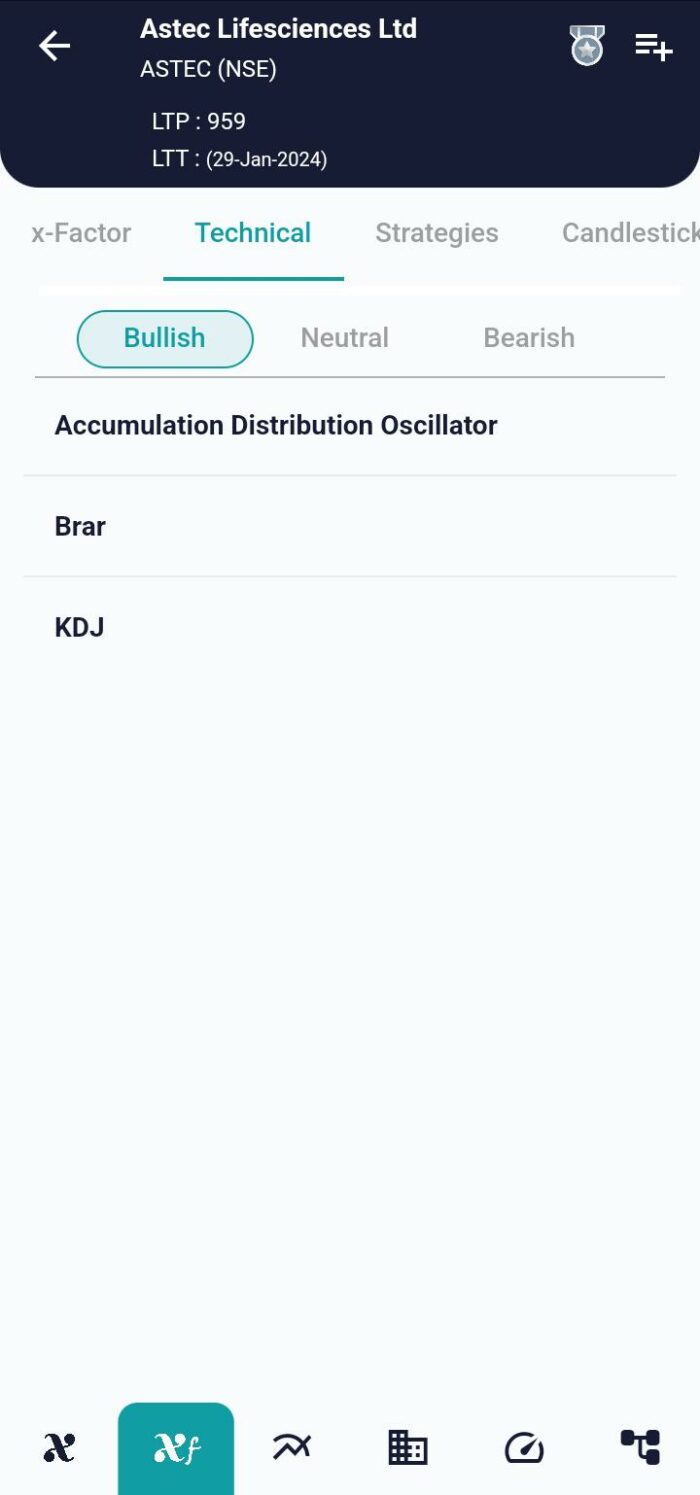
Succeeding Market Trends with BRAR: A Momentum Indicator
The trading industry is dynamic, with marketplaces that are always changing and evolving. Traders and investors apply many tools and indicators to handle these shifts successfully. Dr. Tushar Chande’s invention, the BRAR indicator, is one such effective tool. We will examine the inner workings of BRAR, its mathematical basis, and the ways in which traders might benefit from its insights in this blog article.
Overview of BRAR
Buy-Ratio Analysis, or BRAR for short, is a momentum technical indicator used to measure the amount of purchasing and selling pressure in the market. This tool was created by Dr. Tushar Chande to help traders better understand market dynamics and spot possible trends. The fundamental ideas of BRAR are based on how buyers and sellers act in various market scenarios.
Components of BRAR
The Buy Ratio (BR) and the Sell Ratio (SR) are the two primary components of the BRAR indicator. Based on the correlation between price changes and trade volumes, these ratios are computed.
Buy Ratio (BR): The net advances to the total volume are represented by this ratio. It shows how strong the market’s buying pressure is.
Sell Ratio (SR): On the other hand, it shows the net decreases to the overall volume. It is clear how intense the selling pressure is.
Mathematical formula:
HO_Diff = high – open OL_Diff = open – low
HCY = high – close[-1]
CYL = close[-1] – low
HCY[HCY < 0] = 0
CYL[CYL < 0] = 0
AR = scalar * SUM(HO, length) / SUM(OL, length)
BR = scalar * SUM(HCY, length) / SUM(CYL, length)
Interpretation of BRAR Values
- BR Increase, AR Decrease (or constant): This scenario indicates a potential selling signal. It suggests that despite an increase in buying pressure, the selling pressure is also on the rise or remaining constant.
- AR Increase, BR Decrease (or constant): This configuration signals a potential buying opportunity. When the buying pressure is increasing while selling pressure decreases or remains constant, it suggests a favorable market for buyers.
- Otherwise: If BR and AR move in tandem or remain constant, it indicates a hold signal. Traders may choose to stay in their current positions in anticipation of further market developments.

Leveraging BRAR in Trading Strategies
BRAR can be a valuable tool for traders implementing various strategies. For instance:
- Buying Opportunities: Traders may consider entering long positions when AR is on the rise, and BR is decreasing or constant.
- Selling Opportunities: Conversely, selling opportunities may arise when BR is increasing, and AR is decreasing or constant.
Conclusion
In the ever-changing landscape of financial markets, having robust tools for market analysis is indispensable. BRAR, with its emphasis on buy and sell ratios, provides a nuanced view of market sentiment. As with any technical indicator, it’s essential for traders to use BRAR in conjunction with other tools and analyses for a comprehensive understanding of market conditions.
In conclusion, BRAR empowers traders to make informed decisions, unlocking the potential for identifying trend reversals and seizing opportunities in dynamic markets. Whether you are a seasoned trader or just starting, incorporating BRAR into your analytical toolkit could be a game-changer.
xCalData is an exceptional app available for Android devices that offers unbiased insights into stocks, allowing investors to make informed decisions. With its user-friendly interface and comprehensive features, xCalData provides a valuable resource for anyone interested in the stock market. Download the app from google play.
For Actionable Intelligence, subscribe to xCalData app on Android devices: https://tinyurl.com/downloadxCalData
Popular Posts
-
Stock of Interest . August 23, 2024
#HSCL (NSE) Stock Report | 23 Aug 2024
-
Stock of Interest . August 23, 2024
Add Zerodha trading account to xCalData
-
Stock of Interest . August 23, 2024
What is xCalData , how to use it and how accurate is it?
-
Stock of Interest . August 23, 2024
Jurik Moving Average (JMA): A Profit Trading Insight