Technical Indicator
Posted On: February 8, 2024
Success Trading Insights: Demystifying Stochastic RSI (StochRSI)
Introduction:
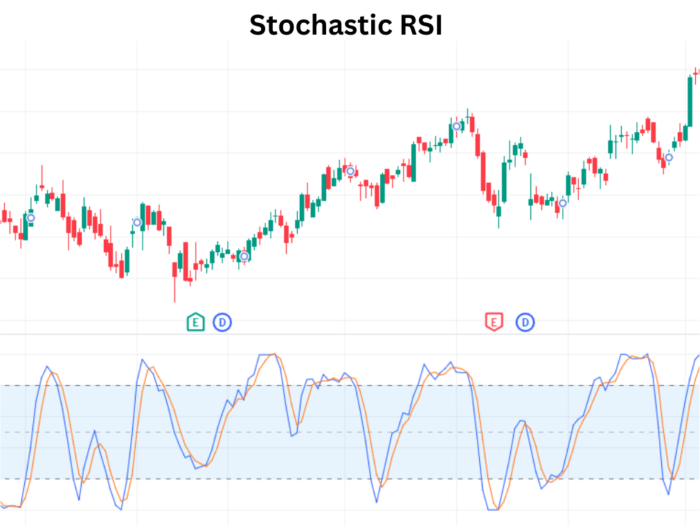
The Stochastic RSI (StochRSI) combines the power of two popular technical indicator , Stochastic oscillator and Relative Strength Index (RSI), providing traders with a nuanced perspective on overbought and oversold conditions. This comprehensive guide delves into the mechanics of StochRSI, its interpretation, and how traders can leverage its signals for informed decision-making.
Understanding Stochastic RSI:
The Stochastic RSI ranges between zero and one (or zero and 100 on some platforms) and applies the Stochastic oscillator formula to RSI values rather than standard price data. This approach offers insights into the overbought or oversold status of the RSI, helping traders anticipate potential trend reversals.
Mathematical Formula:
StochRSI= RSI−min[RSI]/max[RSI]−min[RSI]
where:
RSI=Current RSI reading
min[RSI]=Lowest RSI reading over the last 14 periods
max[RSI]=Highest RSI reading over the last 14 periods
stochrsi_k = sma(StochRSI, length=k)
StochRSI d = ma(StochRSI k, length=d)
Key Concepts:
- StochRSI Value Ranges:
- Between 80 and 50 on the way down: Bullish signal.
- Greater than 80 on the way down: Strong Bullish signal.
- Between 20 and 50 on the way down: Bearish signal.
- Less than 20 on the way down: Strong Bearish signal.
Interpreting StochRSI Signals:
- Bullish Signals:
- Stochastic RSI values between 80 and 50 signal a Bullish trend.
- Values greater than 80 on the way down indicate a Strong Bullish sentiment.
- Bearish Signals:
- Stochastic RSI values between 20 and 50 suggest a Bearish trend.
- Values less than 20 on the way down represent a Strong Bearish sentiment.
Practical Application:
- Identifying Overbought and Oversold Conditions:
- Stochastic RSI values above 80 suggest overbought conditions, potentially indicating an upcoming reversal.
- Values below 20 indicate oversold conditions, hinting at a potential bullish reversal.
- Divergence Analysis:
- Traders can use Stochastic RSI divergence from price action to anticipate trend shifts.
- Bullish divergence occurs when Stochastic RSI forms higher lows amid lower lows in price, signaling a potential bullish reversal.
- Customization for Precision:
- Traders can adjust Stochastic RSI parameters to align with their trading preferences.
- Experimentation with different time periods enhances the adaptability of StochRSI to various market conditions.
Conclusion:
The Stochastic RSI serves as a powerful tool for traders seeking a refined understanding of market conditions. By incorporating RSI values into the Stochastic oscillator framework, StochRSI offers a nuanced perspective on overbought and oversold levels. Traders can leverage its signals to make informed decisions, whether confirming trend directions, identifying potential reversals, or fine-tuning their trading strategies. As a versatile indicator, StochRSI stands at the forefront of technical analysis, contributing to a trader’s toolkit for navigating the complexities of financial markets.
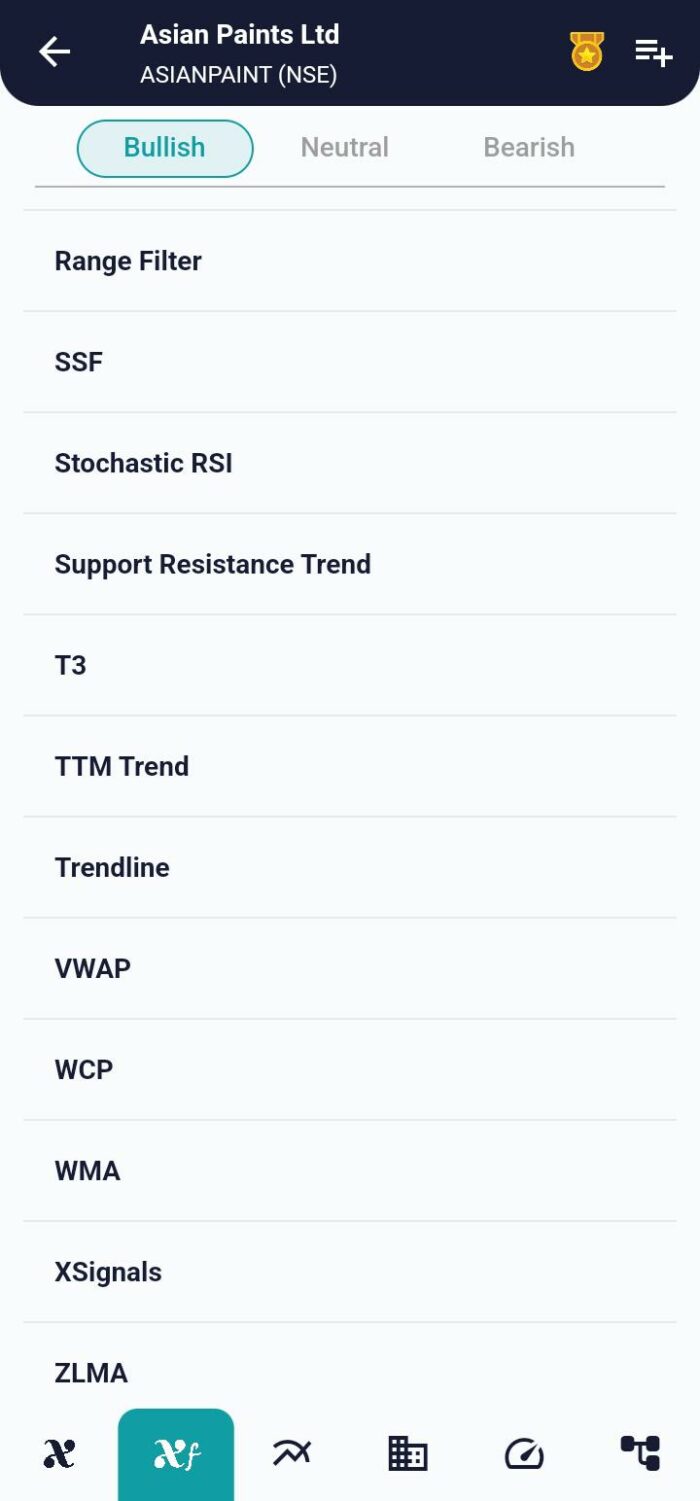
xCalData is an exceptional app available for Android devices that offers unbiased insights into stocks, allowing investors to make informed decisions. With its user-friendly interface and comprehensive features, xCalData provides a valuable resource for anyone interested in the stock market. Download the app from google play.
For Actionable Intelligence, subscribe to xCalData app on Android devices: https://tinyurl.com/downloadxCalData
Popular Posts
-
Stock of Interest . August 23, 2024
#HSCL (NSE) Stock Report | 23 Aug 2024
-
Stock of Interest . August 23, 2024
Add Zerodha trading account to xCalData
-
Stock of Interest . August 23, 2024
What is xCalData , how to use it and how accurate is it?
-
Stock of Interest . August 23, 2024
Jurik Moving Average (JMA): A Profit Trading Insight